![]()
S-HIS Observations versus ECMWF/NOAA-RTG SST
L. Strow
Updated: Aug 22, 2001
Document URL: http://asl.umbc.edu/pub/airs/exercises/shis/shis.html
![]()
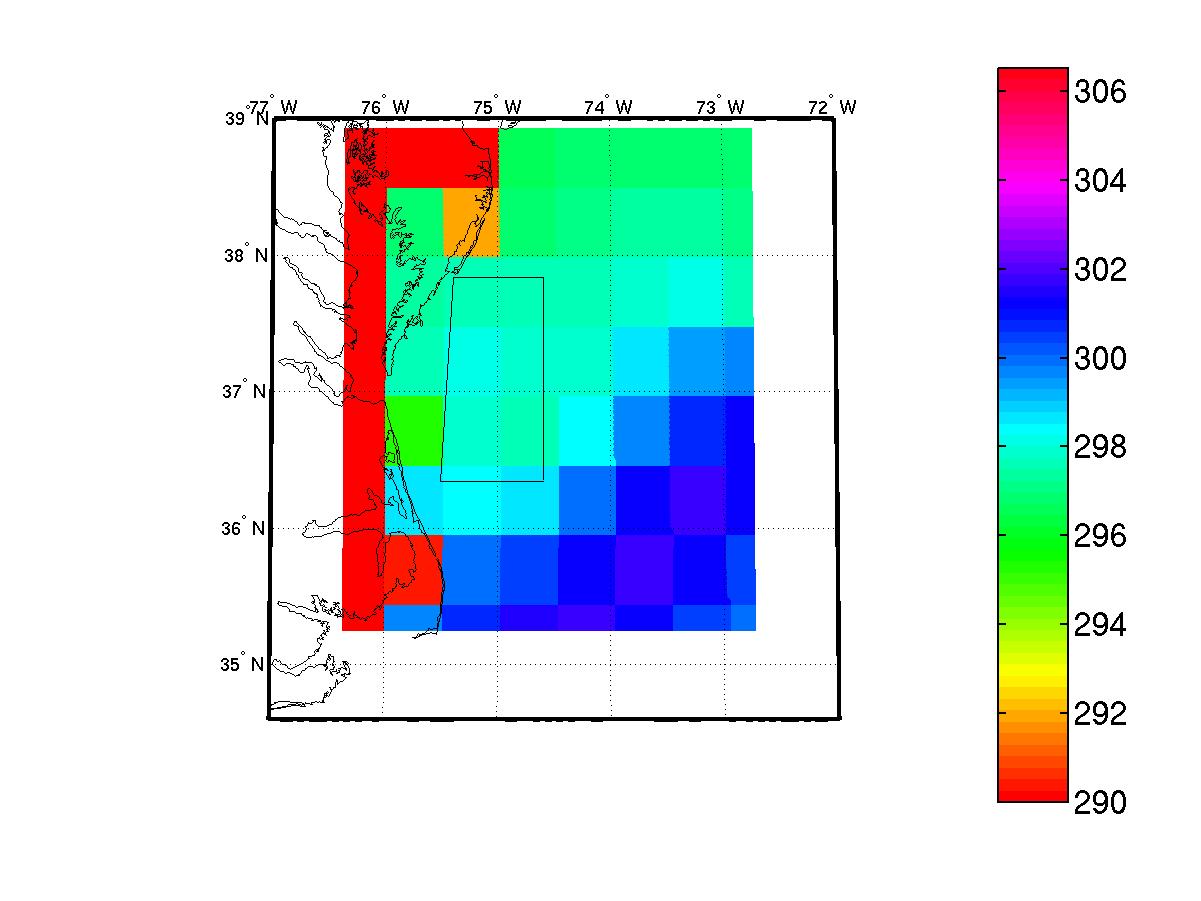
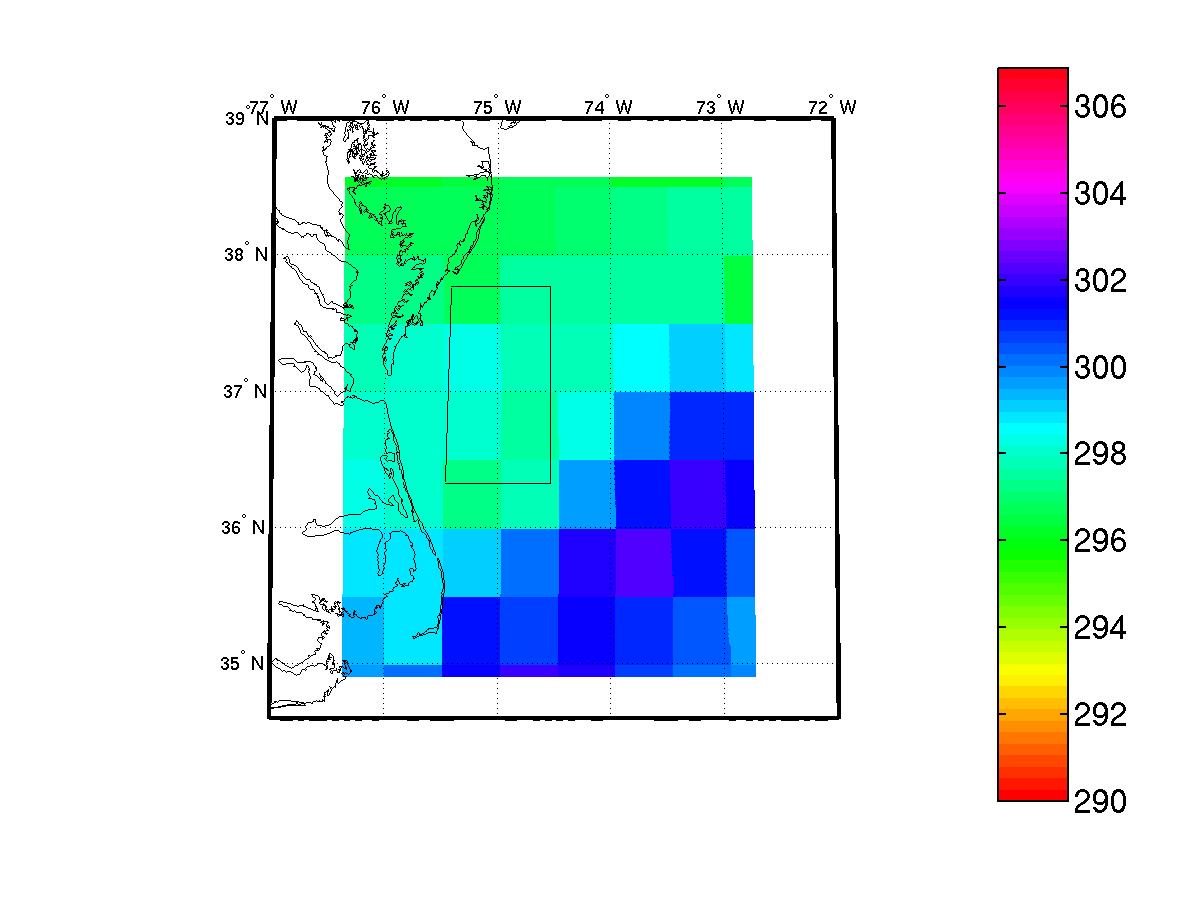
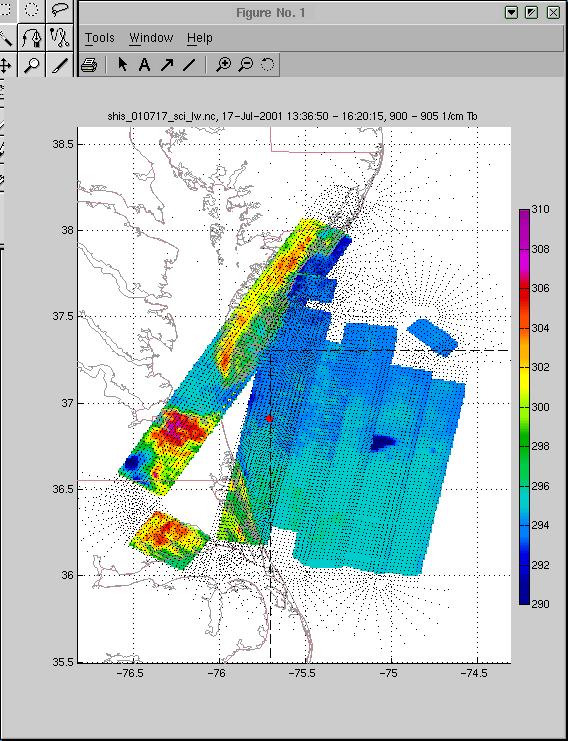
Shown below are SST maps in the vicinity of the CLAMS/S-HIS observations in the 900-905 cm-1region provided by Dave Tobin at U. Wisc. Note that there has been no correction applied to any of these data for atmospheric transmission.
Note that the ECMWF SST and the NOAA-RTG SST are quite similar.
The following graph is the sea surface in the ECMWF model for July 17 (more details later).

The following graph is the sea surface given by the NOAA RTG SST product for July 17.

For now the color scales are every so slightly different. I'll work on this.
Here is Dave Tobin's S-HIS map for the same day, averaged over 900-905 cm-1. Next thing is to compute how much the atmospheric transmission in this region lowers the observed B(T).
