Degrees of Freedom for JPL-CIRAS CubeSat Sounder
Mon, Nov 9, 2015Overview
A first look at the CIRAS sounding channel performance is given here using the Optimal Estimation (OE) framework for deriving degrees of freedom (DOFs) in a retrieval for a particular profile.
This is a linear analysis, with the assumption that the observation errors are Gaussian. Some results are given using a forward model (RMS) error of 0.2K, but, unless stated, no forward model error is introduced. A diagonal covariance matrix is used, set to 2K for the temperature profile and 40% for the water vapor amount. These are reasonable numbers for a real-time weather forecasting model, especially in regions of fronts and severe storms. Here we are primarily concerned with relative performance, so the choice of an accurate a-priori covariance is not of great importance.
We present the DOFs for AIRS, CrIS normal resolution, CrIS high spectral resolution, and IASI for comparison to CIRAS. All channels were used in the analysis for all instruments. Tests using the AIRS L2 channels showed essentially no change, even if the shortwave HDO channels were removed (which has been done in a V6+ development version of the L2 retrieval.
The CIRAS instrument was modeled with the IASI spectral response functions, and a NeDT = 0.25K at 250K. Channel spacing was 0.25 cm-1, not the proposed 0.2 cm-1 for CIRAS. CIRAS was defined to work between 1965 and 2090 cm-1.
Unfortunately, we are not positive what atmospheric profile was used here, the Jacobians used for this work were probably computed using either a tropical profile or the U.S. standard profile. We will re-do these calculations with a range of (known) profiles in the future.
These are simultaneous DOFs, in that we determine both the temperature and water vapor DOFs for a single retrieval of both profiles.
Several results include RTA RMS errors of 0.2K. This is a rough proxy for how a data assimilation system might behave, since instrument noise and RTA (or model) errors are combined. Comparing Figs. 1 and 3, you see that added in the RTA error makes the DOFs for AIRS and CIRAS almost identical up to 700 mbar.
CIRAS has slightly higher lower tropopsheric temperature DOFS than AIRS (Fig. 1), but slightly lower tropospheric water vapor DOFS than AIRS (Fig. 5). For example, Figure 5 says that AIRS has about 3 DOFs from the surface to 550 mbar, while CrIS has 3 DOFs from the surface to 450 mbar, ie AIRS has slightly more information content in the lower- to mid-troposphere.
Graphs are provided with just AIRS and CIRAS, and graphs with all instruments (with CrIS, CrIS high-resolution, and IASI). The low noise of CrIS appears to make it the better sounder, but it is quite difficult to actually utilize that low noise since a nearly perfect RTA is needed, complete removal of cloud signals, etc.
Results
The table below shows the total DOFs found for the temperature and water vapor profiles for the atmospheric state used in this analysis. As expected AIRS, CrIS, and IASI have similar performance. CIRAS has fewer DOFs due to its limited spectral range, but as will be shown below, it provides very good performance in the lower troposphere.
Instrument  Temperature DOFs  Water Vapor DOFs
----------  ----------------  ----------------
AIRS        13.4              7.6
CRIS        14.3              8.3
CRIS HR     15.2              8.9
IASI        12.9              8.3
CIRAS        6.2              4.4
Cumulative Degrees of Freedom
Below we plot the cumulative number of DOFs for each instrument, starting at the bottom of the atmosphere. This provides a very nice summary of where the instrument has sensitivity.
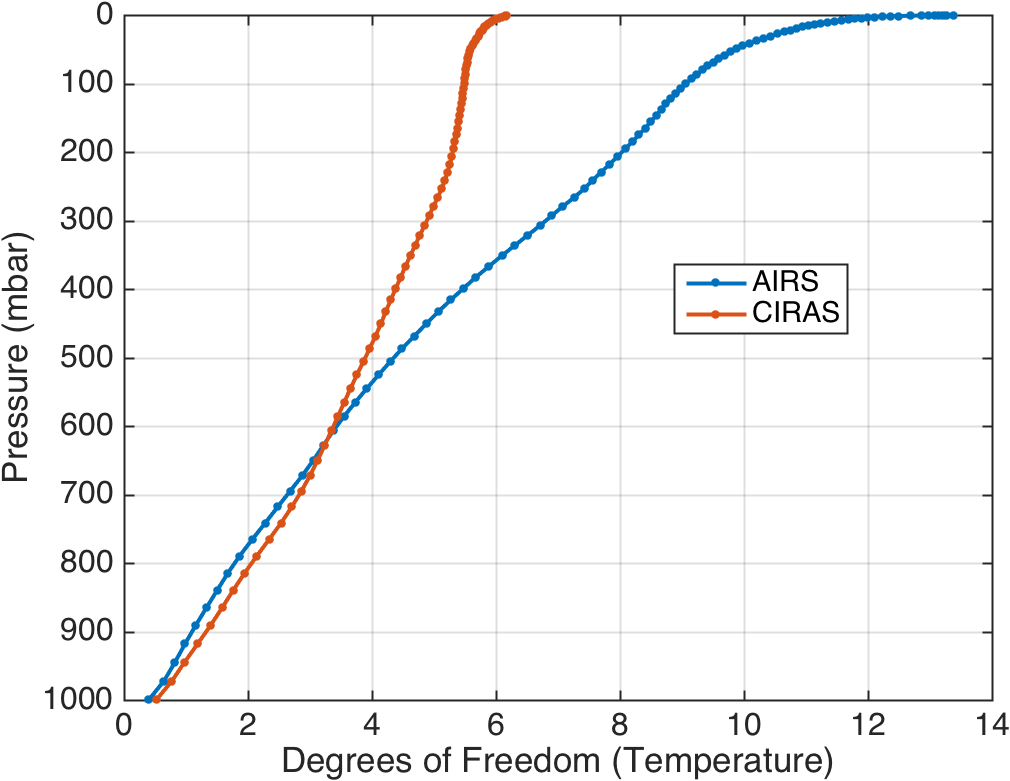
Figure 1: Temperature DOFs.
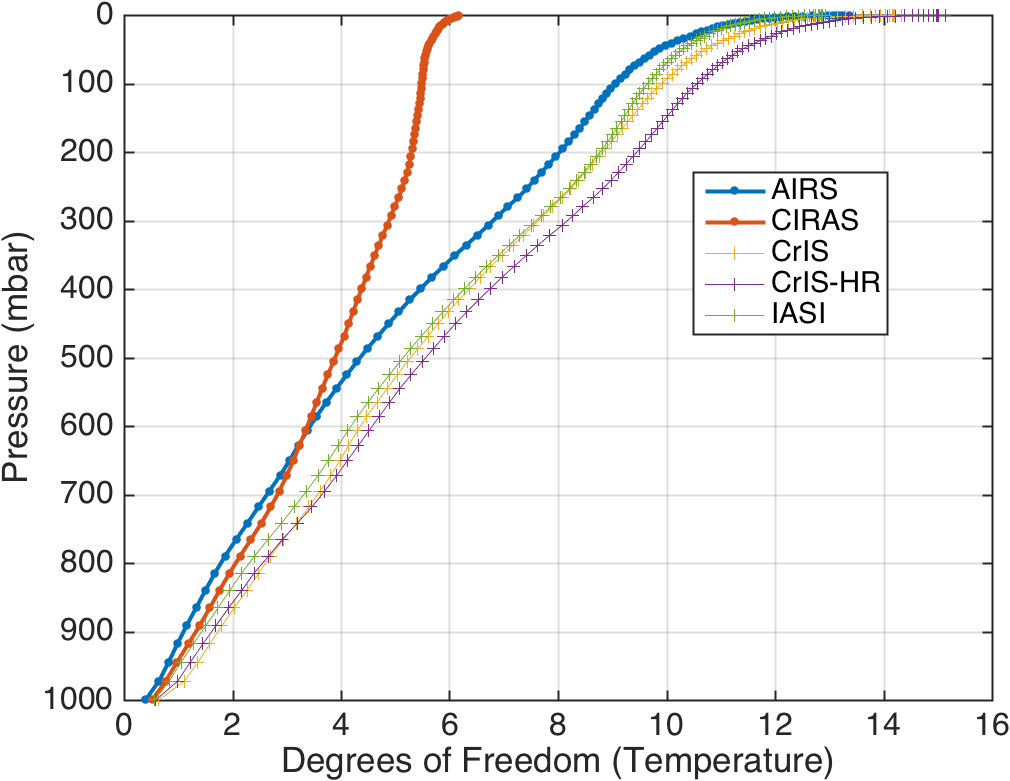
Figure 2: Temperature DOFs with CrIS and IASI
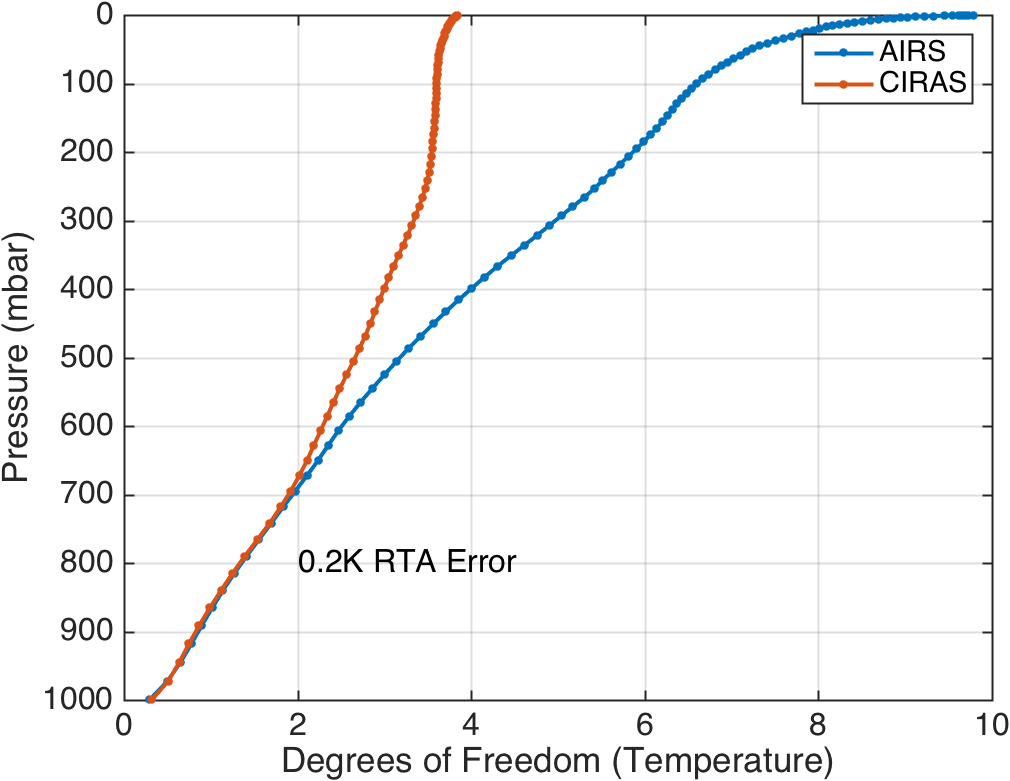
Figure 3. Temperature DOFS with 0.2K RMS RTA error.
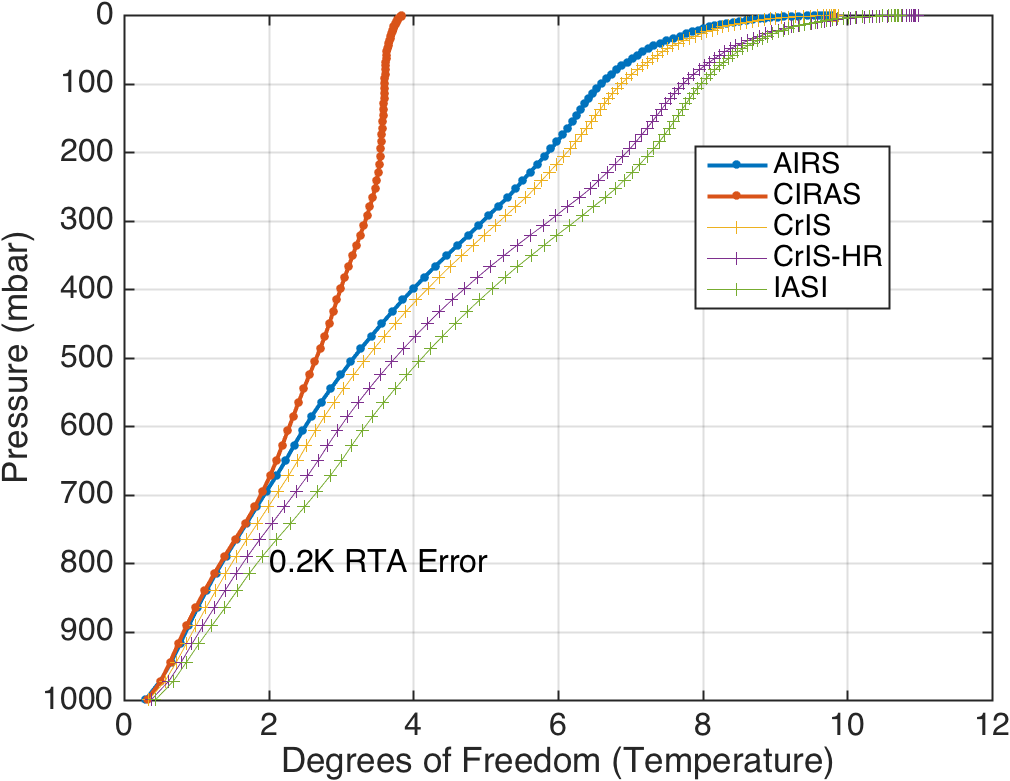
Figure 4. Temperature DOFS with CrIS and IASI with 0.2K RMS RTA Error.
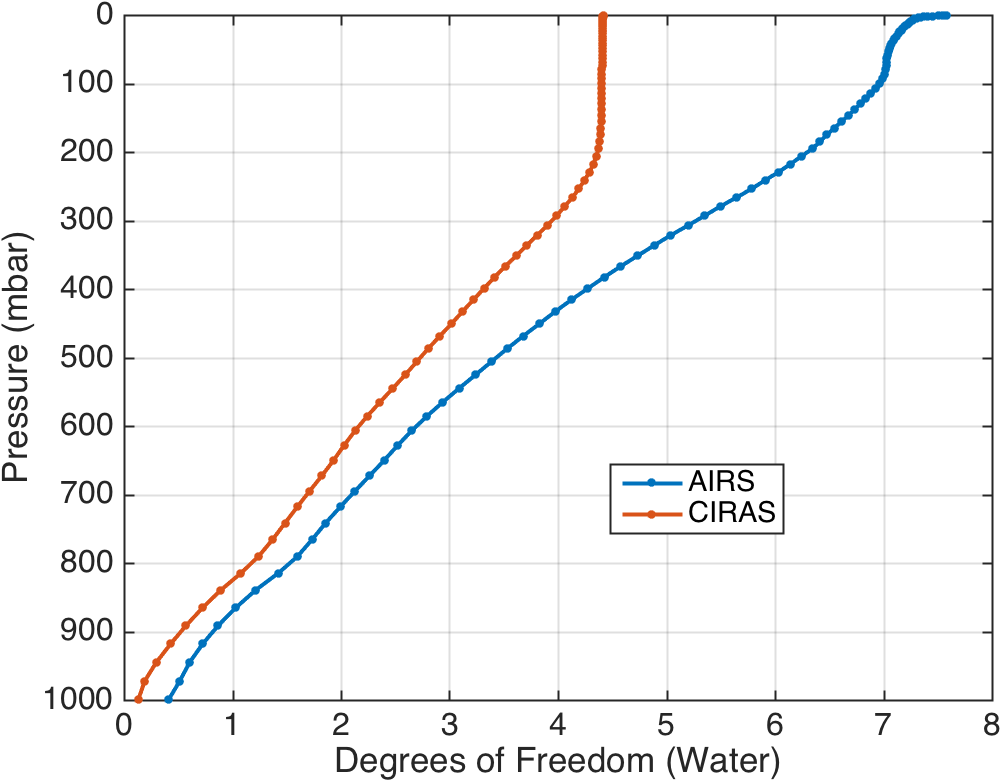
Figure 4. Water Vapor DOFs.
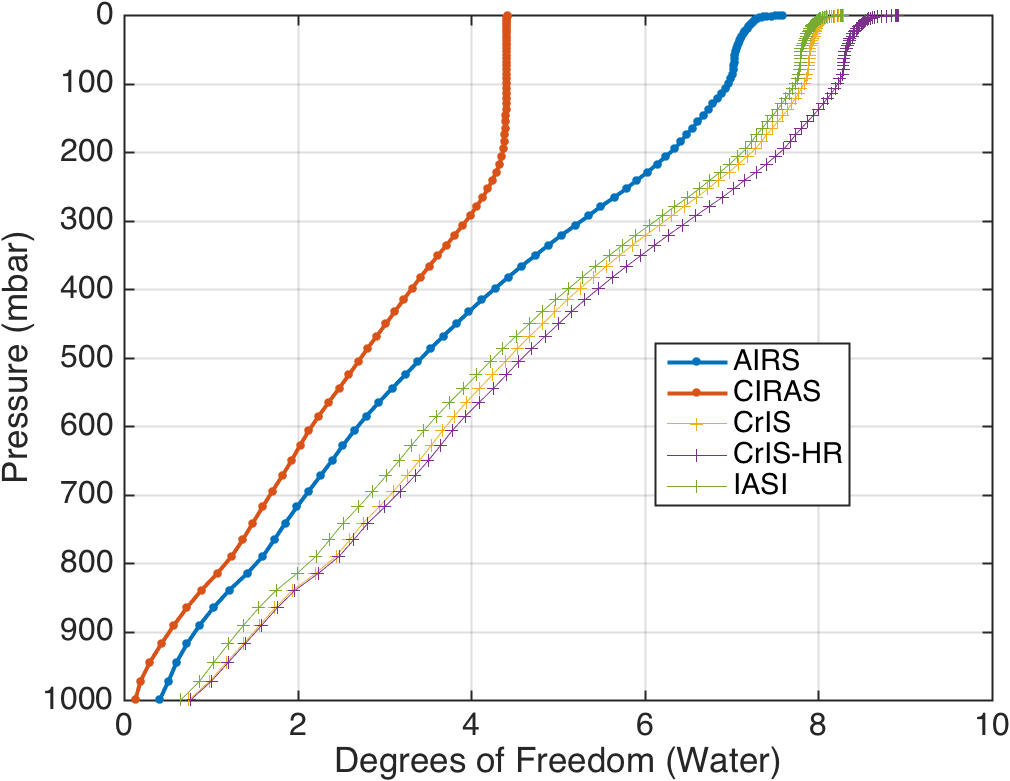
Figure 6. Water Vapor DOFs with CrIS and IASI.

Figure 7. Water Vapor DOFs with CrIS and IASI.
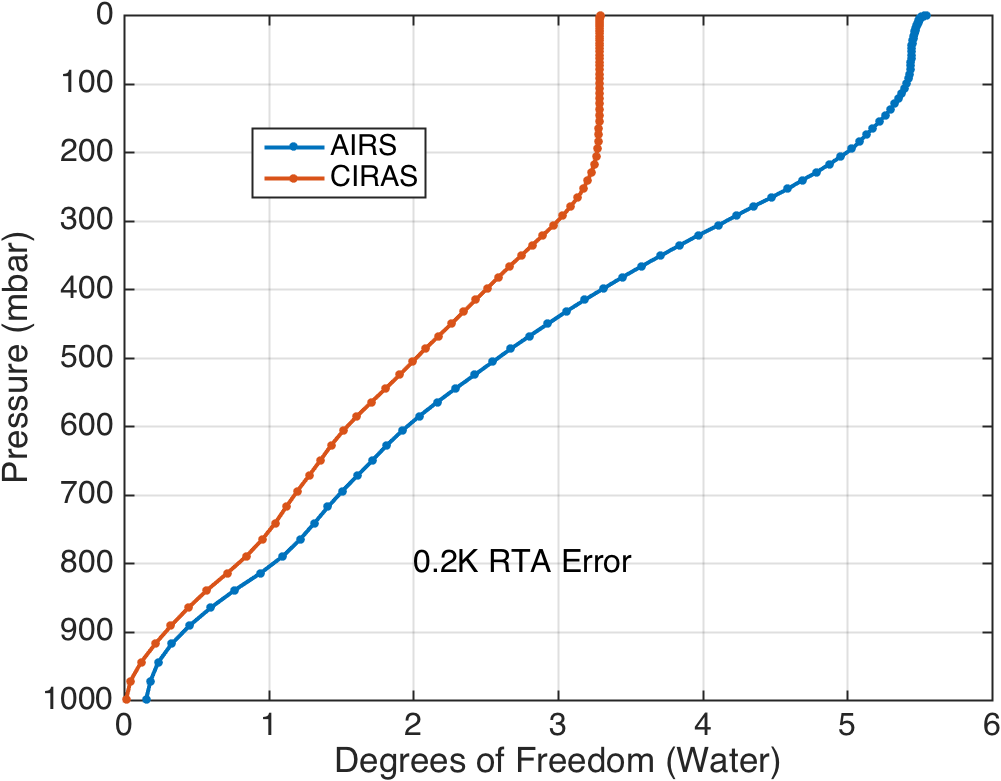
Figure 8. Water Vapor DOFs with 0.2K RMS RTA error.
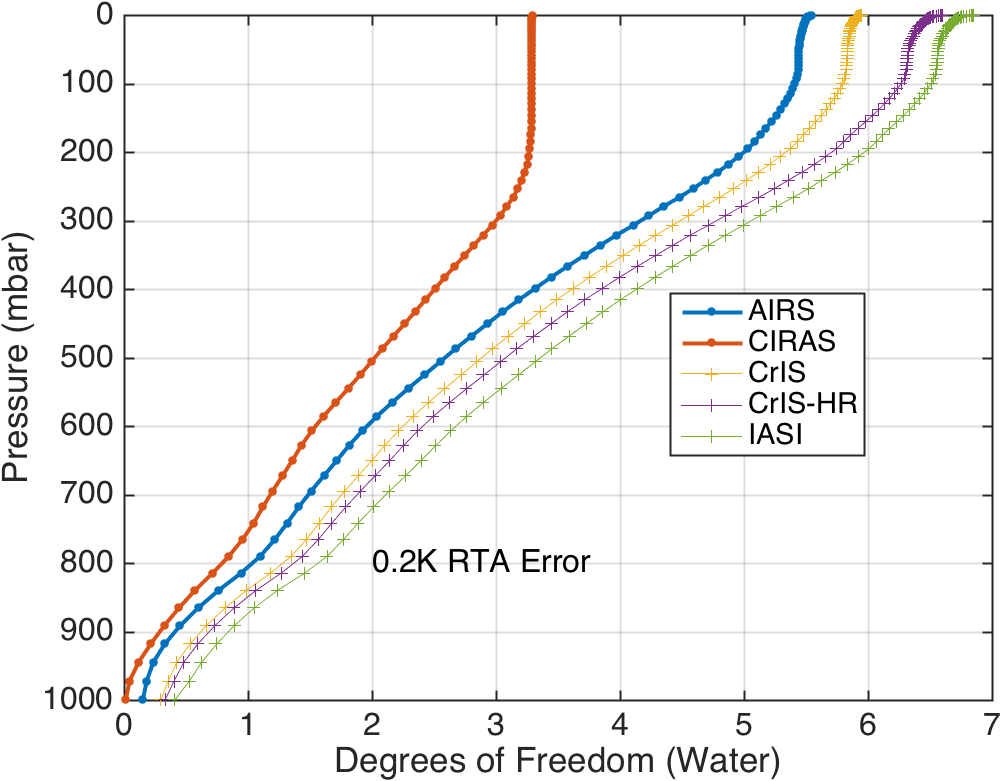
Figure 9. Water Vapor DOFs with CrIS and IASI with 0.2K RMS RTA Error
Averaging Kernels
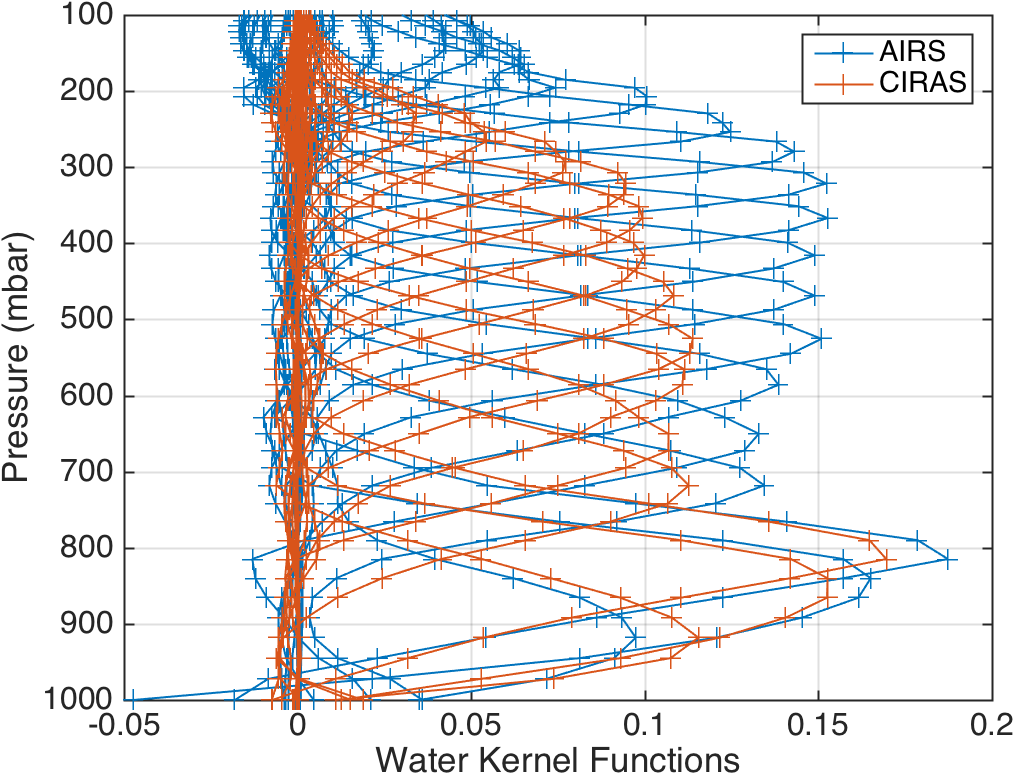
The averaging kernel tells you the retrieval sensitivity for a change in the true profile at some altitude (or pressure). Here we have plotted three averaging kernels, for a true change in the profile at 366, 766 and 972 mbar. We see that for both temperature and water vapor, CIRAS temperature sounding performance is similar to AIRS in the 766 and 972 mbar range, with CIRAS slightly better for water vapor at 972 mbar. At 366 mbar the lack of strongly absorbing channels starts to limit the CIRAS performance relative to AIRS as seen in the slightly wider CIRAS averaging kernels.
We provide a range of graphs showing averaging kernels. The first set shows the averaging kernels for the three pressures given above, followed by 2D images of the kernels for AIRS and CIRAS for temperature and water vapor. This is followed by line plots of the averaging kernels, where we select to show every third averaging kernel (defined by the AIRS RTA 101 atmospheric layering model).
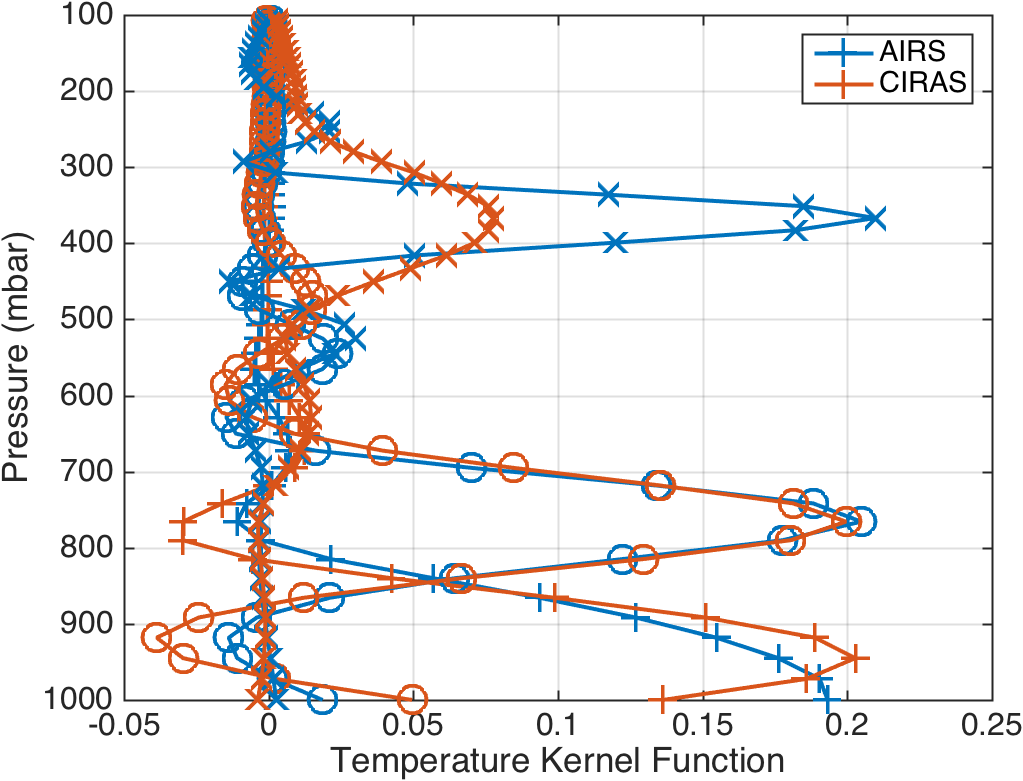
Figure 10. Selected temperature averaging kernels
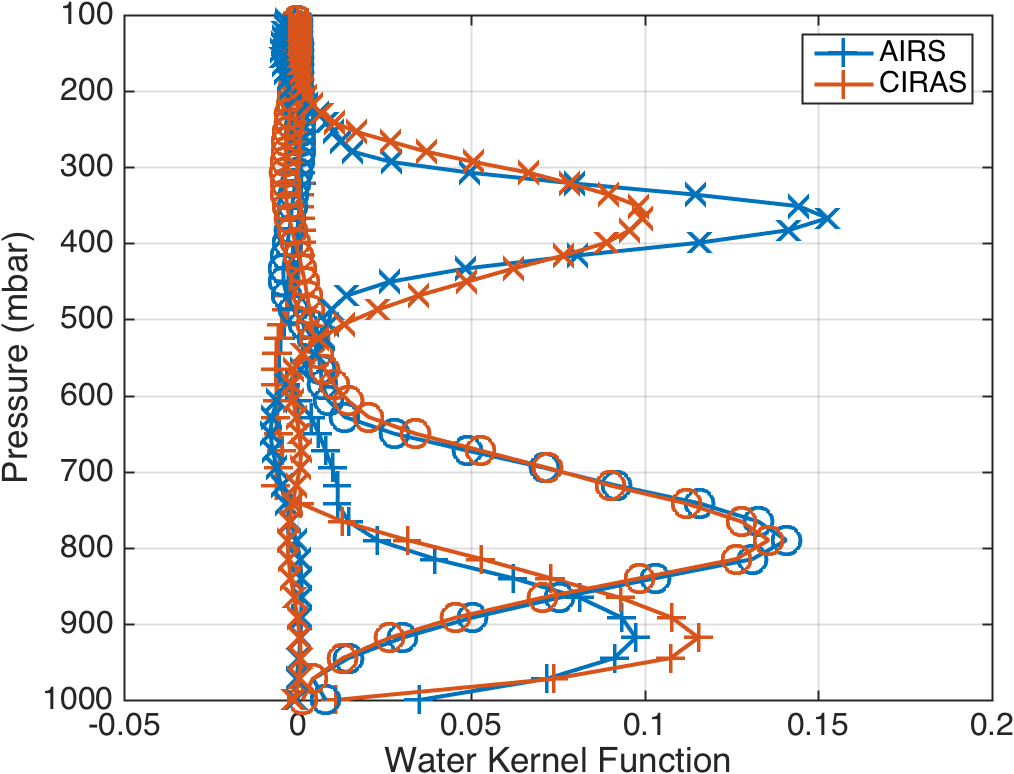
Figure 11. Selected water vapor averaging kernels.
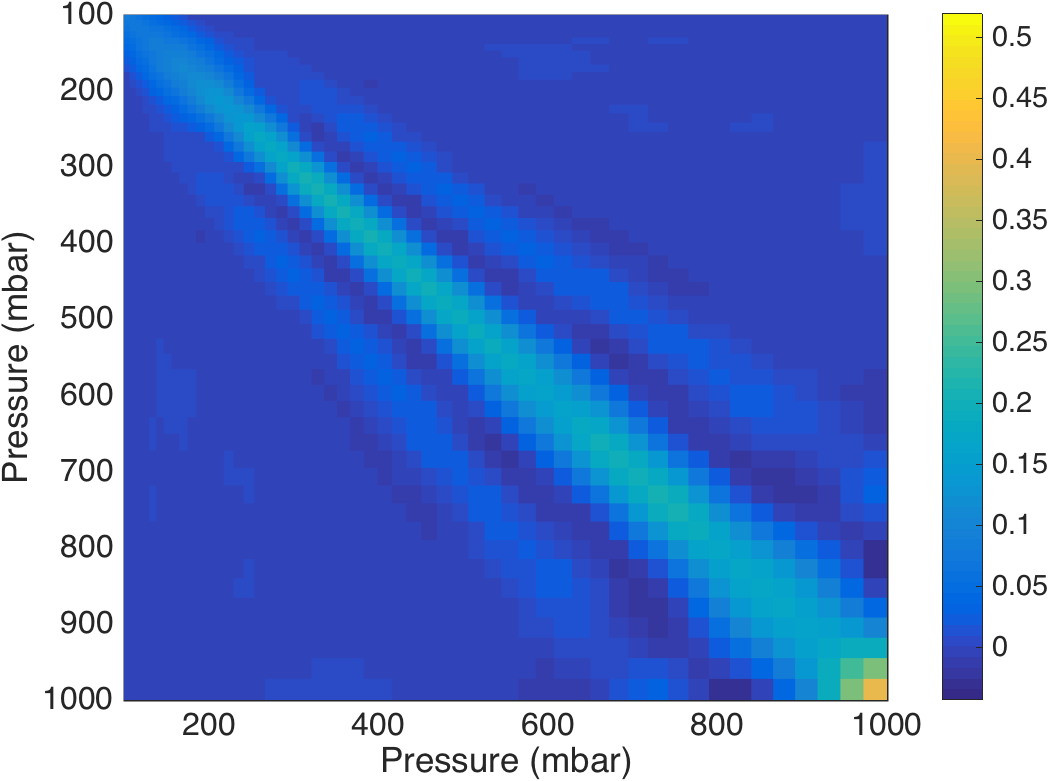
Figure 12. Full set of AIRS temperature kernels.
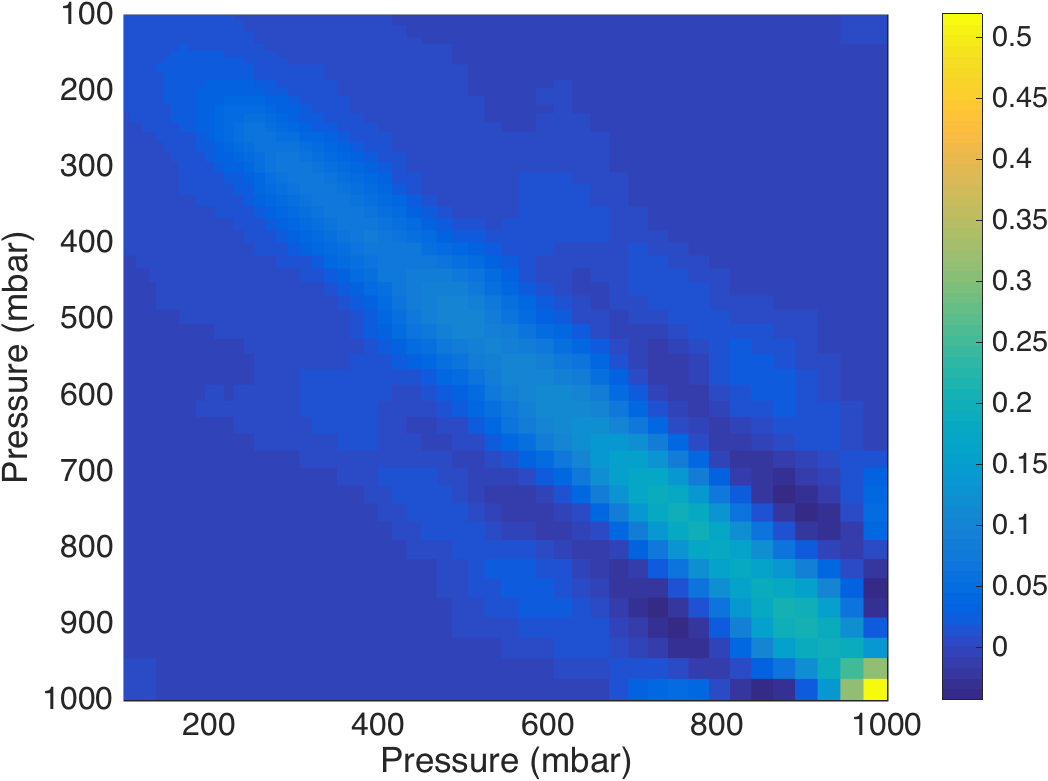
Figure 13. Full set of CIRAS temperature kernels.
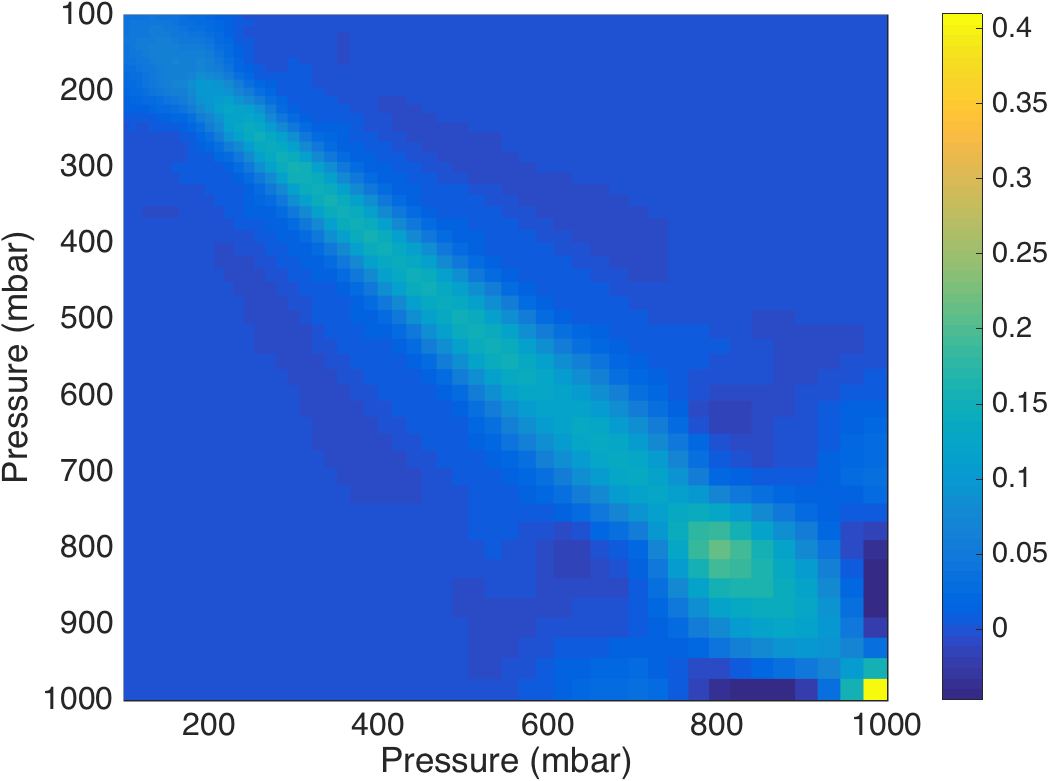
Figure 14. Full set of AIRS water vapor kernels.
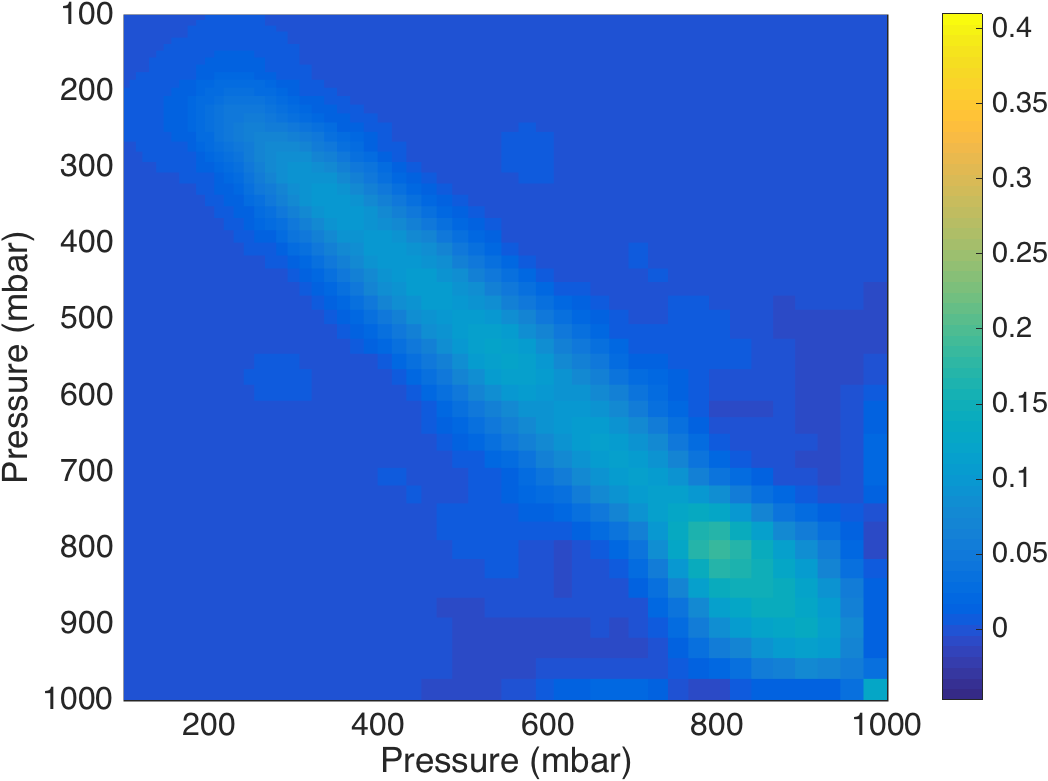
Figure 15. Full set of CIRAS water vapor kernels.
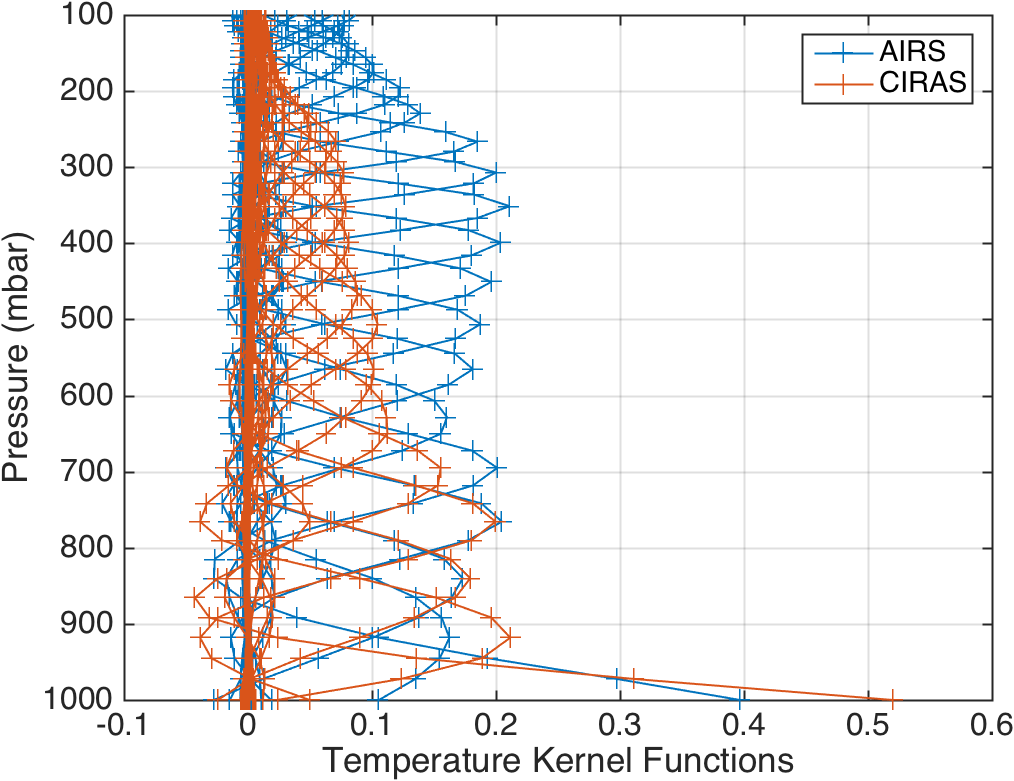
Figure 16. Larger sample of AIRS and CIRAS temperature kernels.
