AIRS DCC Analysis of Radiometric Drifts
Tue, May 16, 20171 Introduction
The AIRS AIRXBCAL DCC changes over time are examined several ways. We also compare to the UMBC-generated IASI DCC subset. Both DCC data sets are daily averages, over all latitudes, of the observed DCCs. Since we are examining the shortwave channels, we restrict observations to nighttime.
We also examine drifts in the different AIRS modules, especially A vs B detector shifts in time.
2 Time Series
2.1 DCC Spectra
Figure 1 shows the daily averaged DCC brightness temperatures of the AIRS 960 and 2616 cm-1 channels. Starting in mid-2007 we also include the IASI 960 cm-1 and the average brightness temperature of 54 channels of IASI centered at 2616 cm-1. The IASI shortwave channels are averaged to lower the noise, otherwise it will be off scale (about 8K standard deviation).
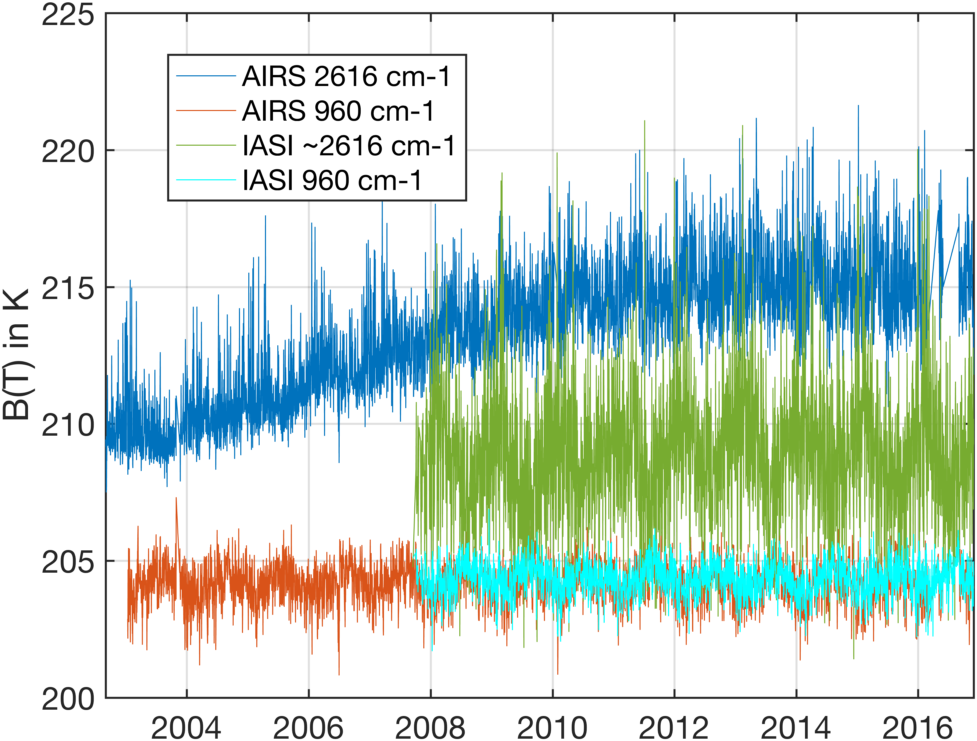
Clearly the AIRS 2616 cm-1 channel drifted higher during this time period, stabilizing in about 2012. Also note that the AIRS and IASI curves for the 960 cm-1 channels are quite similar.
3 Linear Drift in Time
3.1 DCC Spectra
The linear rate of change over time of these daily DCC time series were determined using least-squares fitting. An overview of the full spectrum results in Fig. 2 shows very large rates of change in the shortwave, not unexpected given the time series results shown above. IASI is much noiser than AIRS in the shortwave, which is highlighted by the large uncertainty in the IASI rates (green curve).
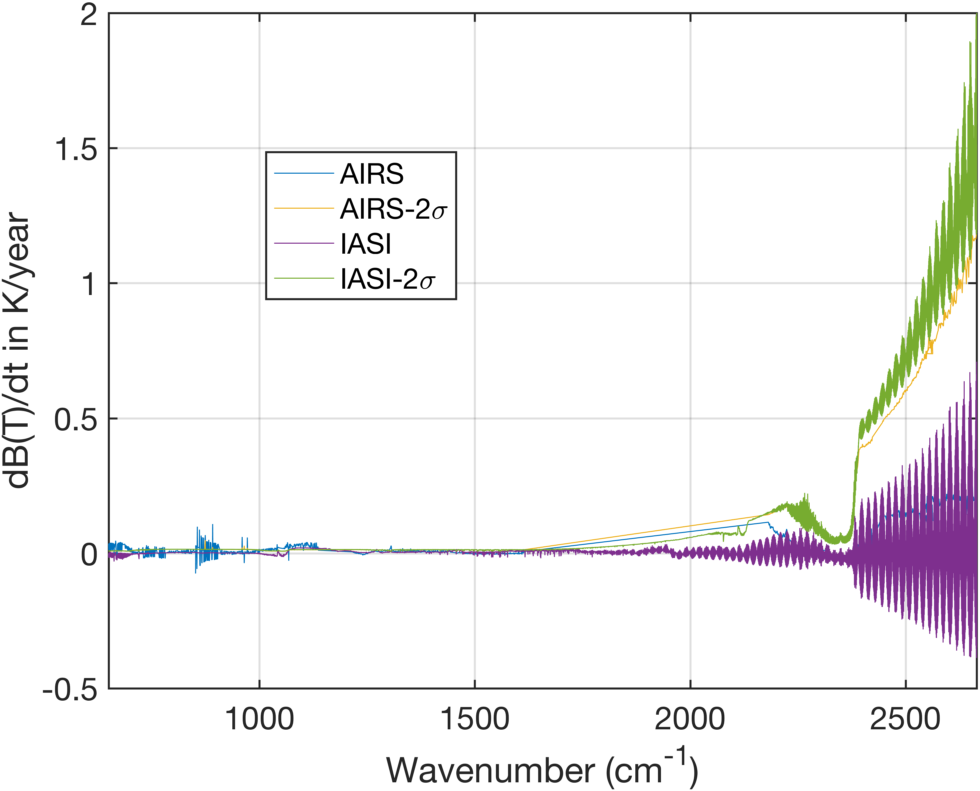
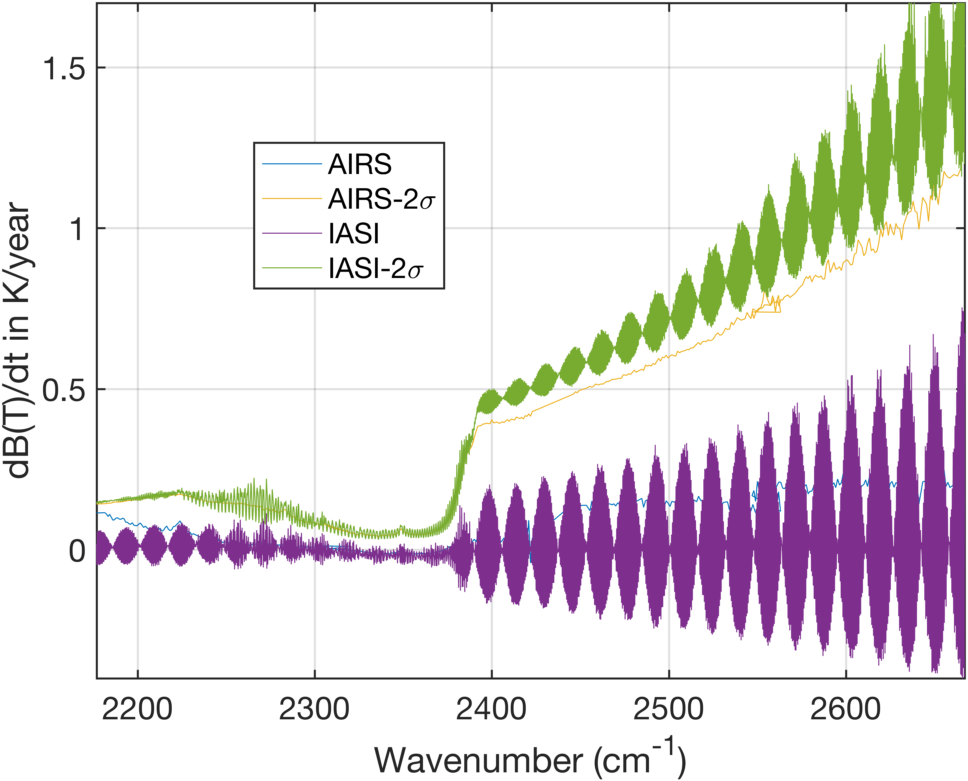
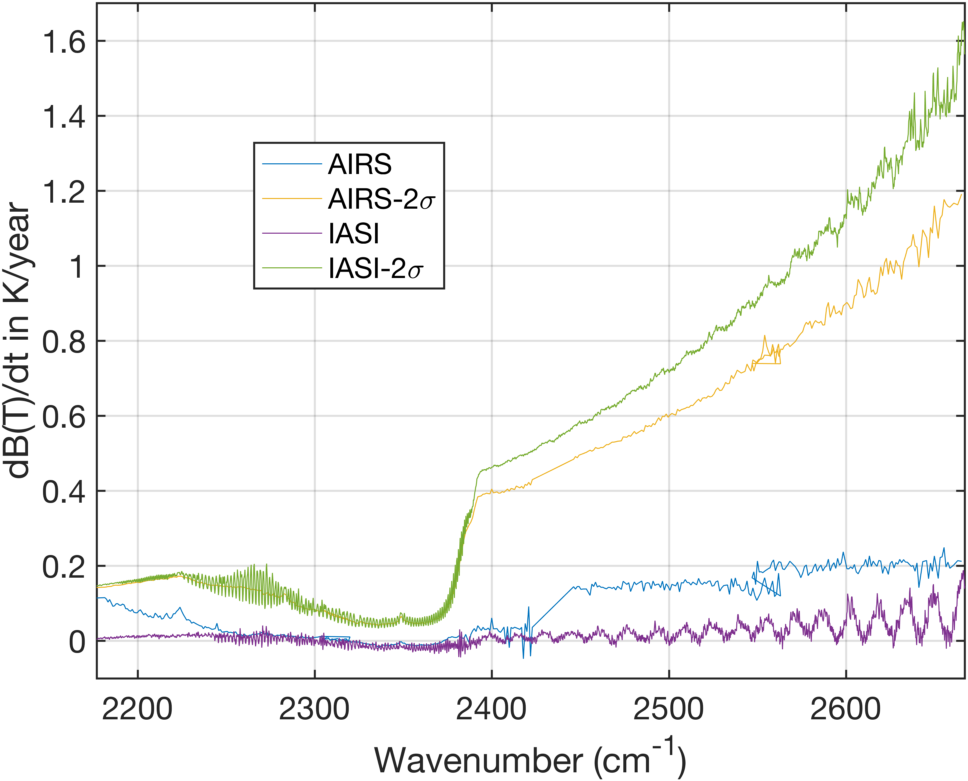
Figure 3 is a zoom of Fig. 2 in the shortwave that shows large ringing in the IASI rates and rate uncertainties. These are due to processing changes in IASI over time by CNES, mostly just changes to fourier-transform ringing. These can be almost completely removed by averaging every two channels together, as seen in Fig. 4.
The longwave portion of these DCC linear rate of change spectra are shown in Fig. 5 included 2-σ uncertainties in the rates, nominally about 0.01K/year for both instruments. There are significant differences in the longwave AIRS PC modules, which are not addressed here. What is seen is significant "ringing" in AIRS due to the differences in A and B detector drift.
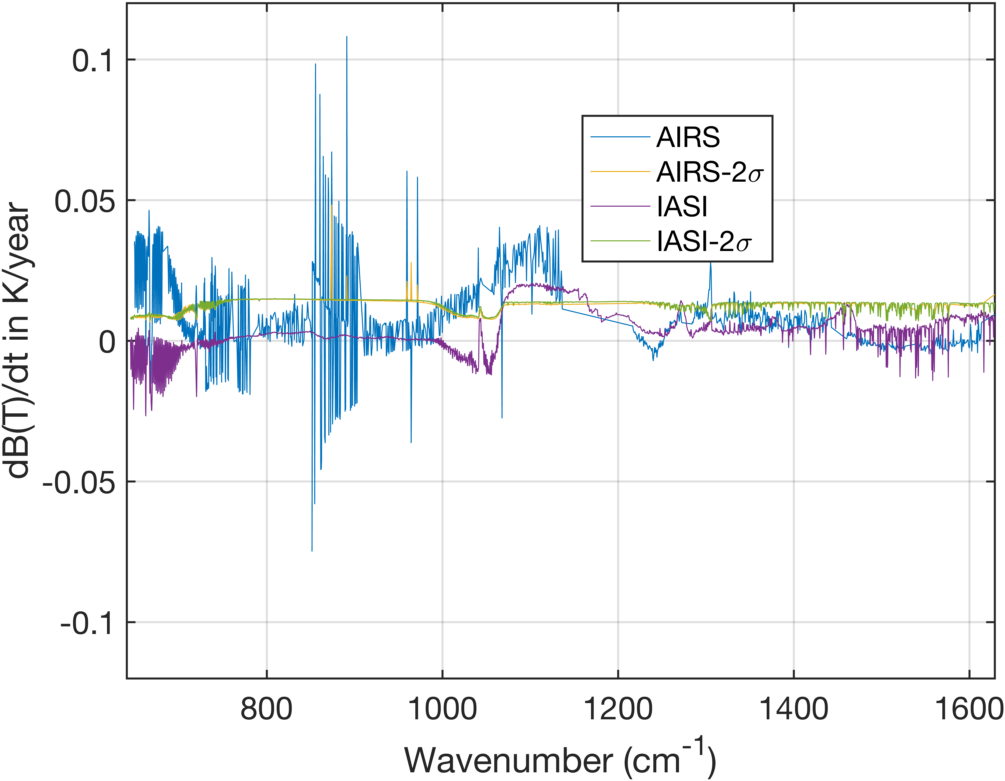
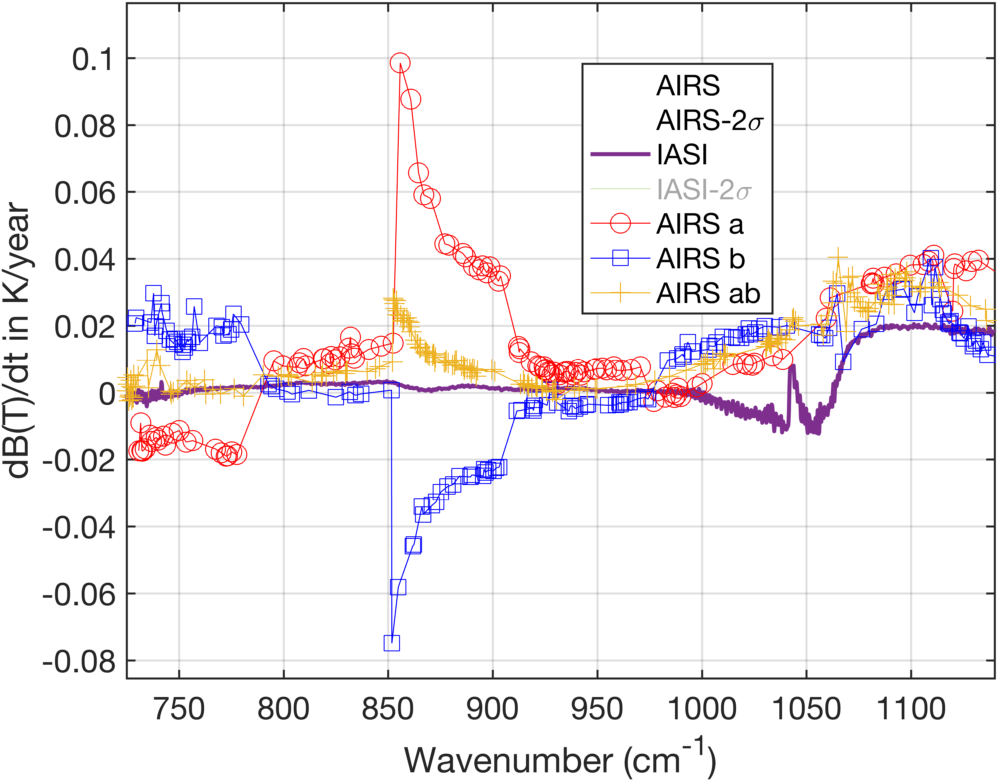
Figure 6 is a zoom with A and B detectors shown with different markers and colors. Clearly, the "ringing" in the DCC drift spectra are just A and B differences in the rate of drift. Note that in the window region the IASI drift is very close to the A + B average, although the DCC selection criteria may partly force this agreement (I need to examine the A/B states of the DCC channels used in AIRXBCAL.)
Note how the A versus B drift can flip with module. The disagreement between IASI and AIRS in the ozone region could simply be a change in ozone over the 4 hour observation time difference.
3.2 Random Spectra
Differential radiance drifts between AIRS and IASI can also be examined using random spectra. Here we use two data sets similar to the the AIRS AIRXBCAL random set, one for AIRS and one for IASI. The main difference between our random sets and the AIRXBCAL AIRS set is equal-area sampling. Otherwise, they are very similar, using near-nadir random selections of scenes.
Identical time periods for both AIRS and IASI were selected (July 24, 2007 through July 23, 2016), and were binned by latitude (40 bins). The linear rate of change of each channel versus time was determined by least-square fitting.
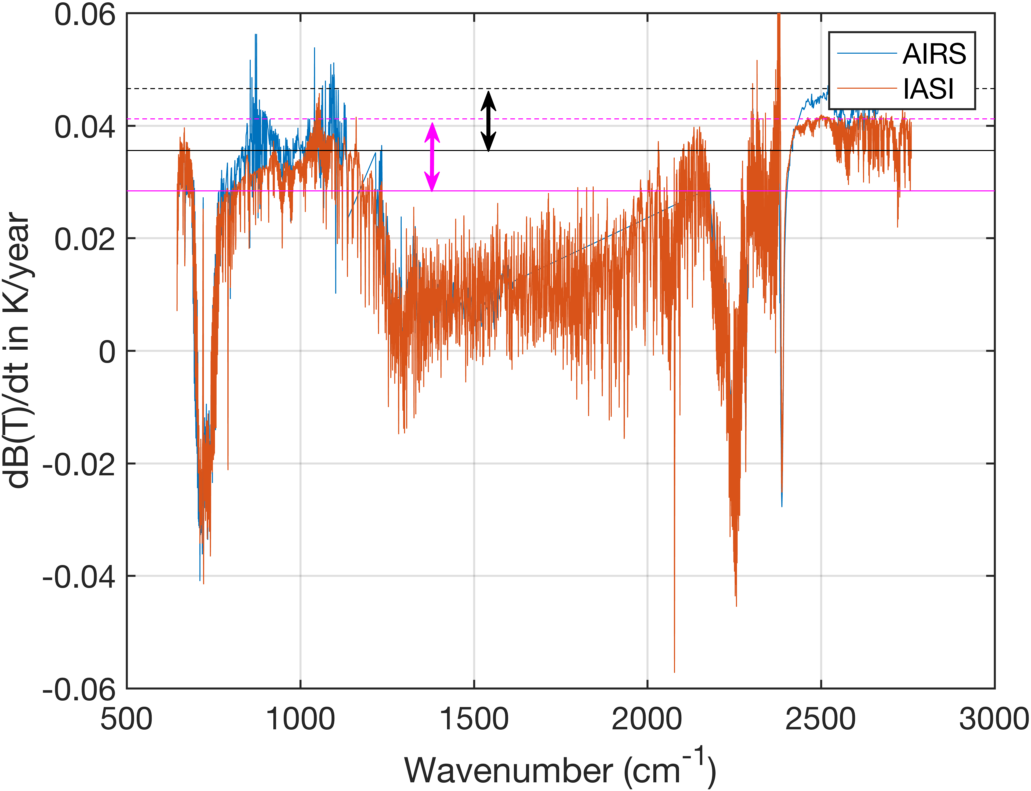
The globally averaged random spectra have much higher radiances than the DCC spectra. For example, the 1231 cm-1 channel B(T) is 275K while the 2616 cm-1 channel is at 282K. Figure 7 shows the linear rate of change for these spectra. They are quite similar, especially in the absorbing bands. AIRS exhibits slightly higher rates in the window regions, by about 0.006K/year, which could be a diurnal trend or could be unimportant given that the time period for this trend is only 9 years.
These spectra do not show any differences between the AIRS 1231 and 2616 cm-1 trends and the same for IASI. The gray and magenta horizontal lines in this figure are drawn at the B(T) values for AIRS and IASI respectively. Similarly the same color but dotted lines are drawn for the 2616 cm-1 channel. The arrows show the B(T) differences between these two channels for AIRS (black) and IASI (magenta). We see here that the differential trend for the IASI channels is actually slightly (0.001K) larger than for AIRS. This suggests that the mechanism for the increase in the AIRS DCC radiances in the shortwave is either not present, or unimportant for these random spectra centered around much higher brightness temperatures. This could be because the DCC spectra are more sensitive to a cold scene offset, etc.
These data sets suggest that future work on trying to model these results may be fruitful, especially if a simple parameterization can be applied to all channels.