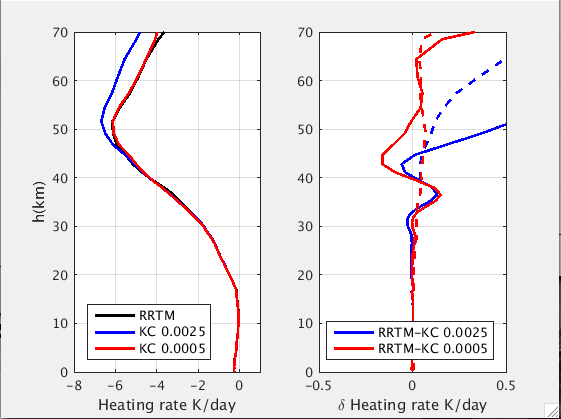
kCARTA Heating Rates
Sun, Feb 21, 2016Location
**/home/sergio/KCARTA/SRC **
**/home/sergio/IR_NIR_VIS_UV_RTcodes/RRTM/v3.3/rrtm_lw/EliMlawer_Dec2015/ **
Overview
Was seeing UA heating rate and flux difference between kCARTA and LBLRTM, with kCARTA about 1.5 K/day too cold compared to LBLRTM
Plot of Tropical(left) and avg over 49 profiles (right)
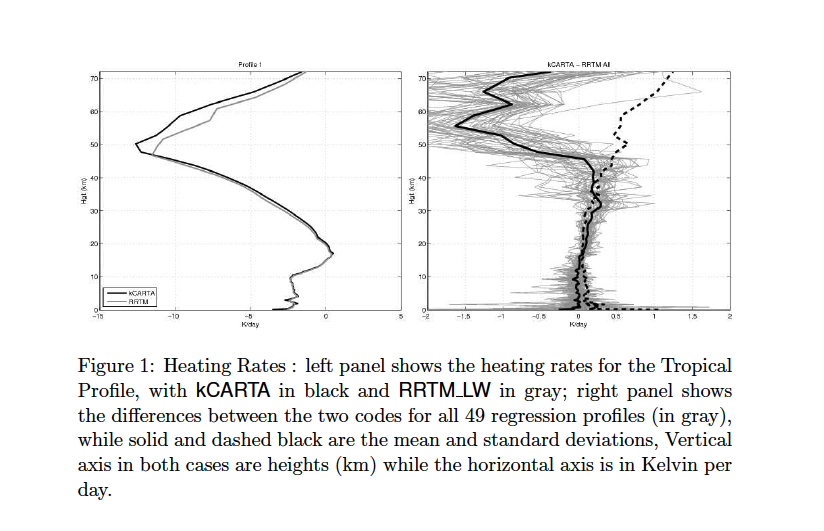
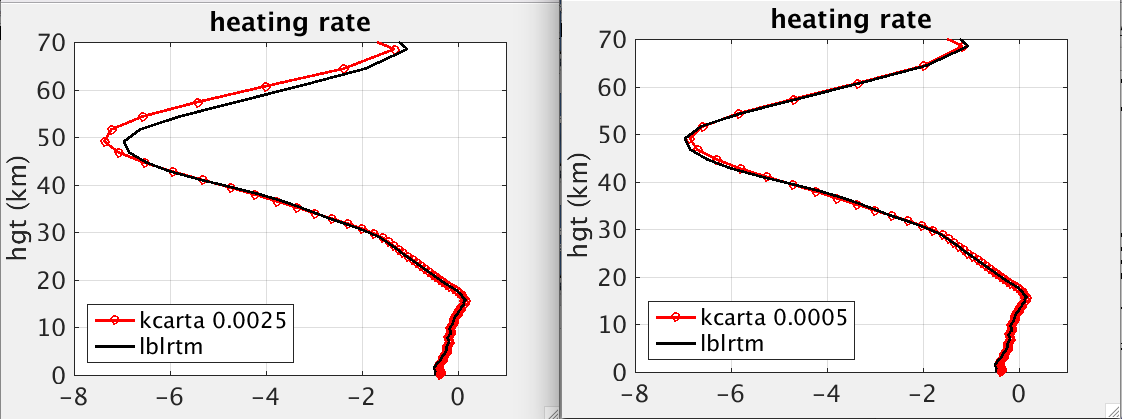
Tracked this down to higher resolution of LBLRTM in UA, compare to kCARTA
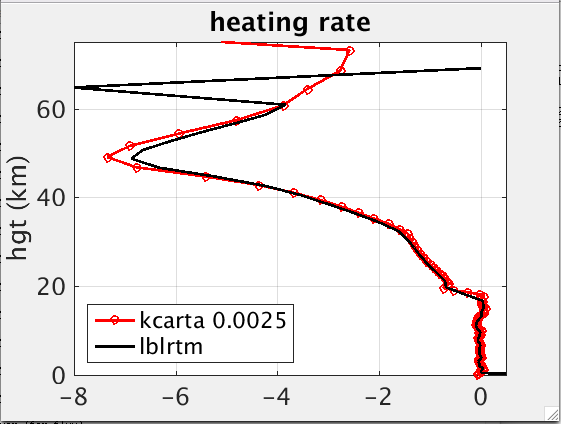
did tests on 630-700 cm-1, on a profile supplied by Eli Mlawer, with inversions in lower atm etc
  kCARTA was recompiled with ../INCLUDE/kcarta_v118HIGHRES_IR.param and
  ../INCLUDE/pre_definedHIGHRES_IR.param so that it "recognizes" a
  database with 0.0005 cm-1 resolution between 605-2830 cm-1, this has
  only been done for gases 1,2,3 between 605-855 cm-1
kCARTA using 0.0025 cm-1 resolution, all gases
kCARTA using 0.0005 cm-1 resolution, gases 1,2,3 and 101,102 only
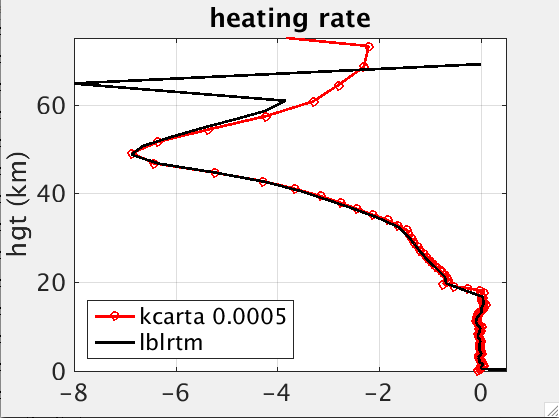
The jiggy-jaggy in the upper atmosphere is due to LBLRTM usings its pressure grid, while kCARTA uses the default AIRS 100 layers here
KCARTA on Anu Dudhia’s RFM Tropical Profile
also see /home/IR_NIR_VIS_UV_RTcodes/RRTM/v3.3/rrtm_lw/AnuDudhia_RFM
kCARTA using 0.0005 cm-1 resolution, gases 1,2,3 and 101,102 only
KCARTA 49 regression profiles vs RRTM, 630-820 cm-1
also see /home/IR_NIR_VIS_UV_RTcodes/RRTM/v3.3/rrtm_lw/Newtest_0.0005kCARTA
kCARTA using 0.0025 and 0.0005 cm-1 resolution, gases 1,2,3 and 101,102 only
