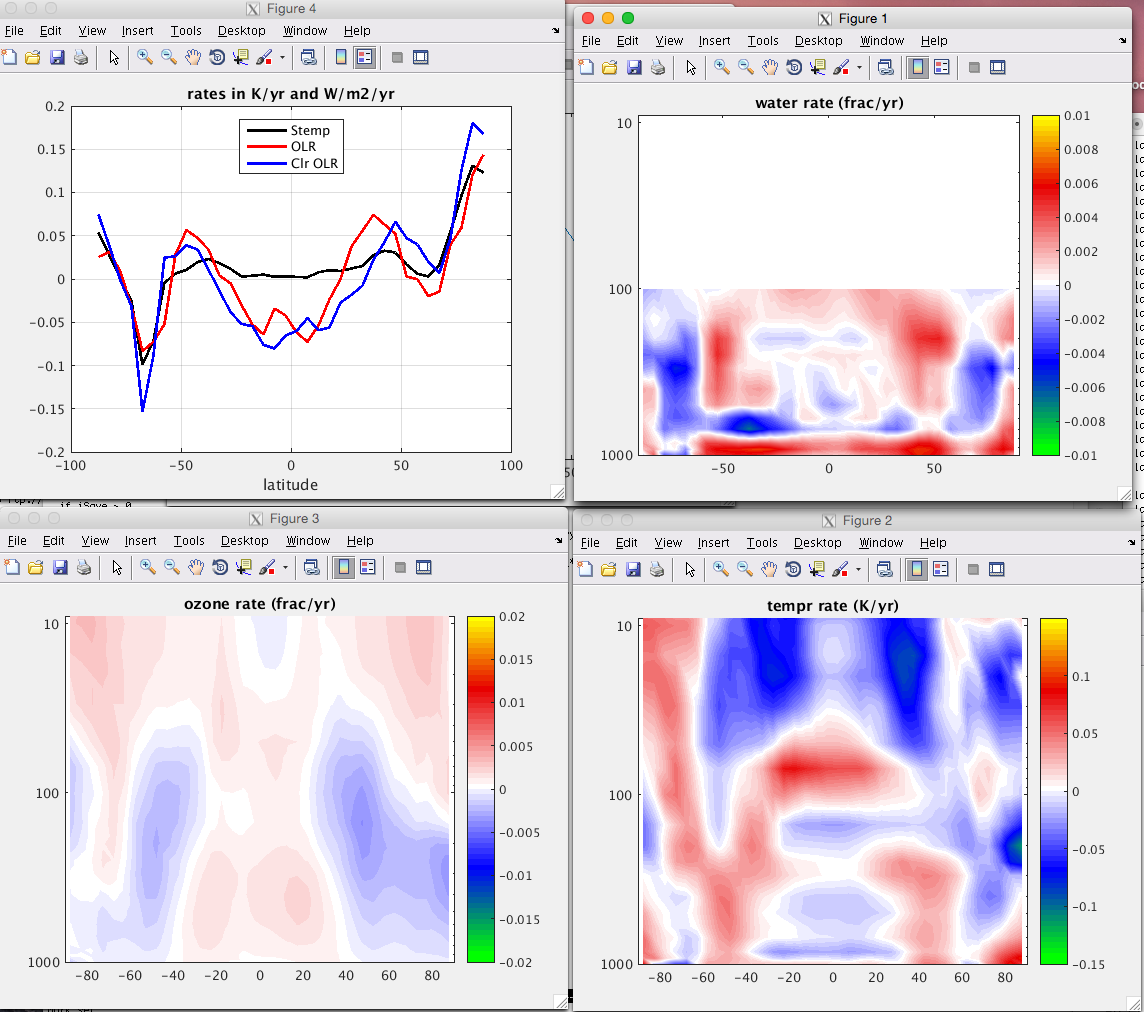
AIRS 12 year rates
Mon, Feb 15, 2016Location
/home/sergio/MATLABCODE/AIRS_L3/airsL3_ratesv6_Sept2015_newlatbins.m
Data, and how to get data, is in
/asl/s1/sergio/AIRS_L3/getter
wget -r -l 1 -nc -np ftp://acdisc.gsfc.nasa.gov/ftp/data/s4pa/Aqua_AIRS_Level3/AIRX3STM.006/2014/*.hdf
Overview
A quick look at linear trends from AIRS L3
36 latbins (from -90 : 5 : +90)
Zonal, nighttime (descending AIRS L3 data)
OLR does not follow stemp in the tropics and mid-lats … clouds/RH to blame?
can definitely see changes in O3 rates (dO3/dt magnitudes decreasing as time span increases)
same with WV rates (dWV/dt magnitudes decreasing as time span increases)
can definitely see changes in T rates (dT/dt t 10 years had lots of cooling in SML, UA .. not in 12,13 year rates; not as much heating at NP)
almost looks like tropics in IA were drying between 2002-2008 then after El Nino they started wetting
also wondering if the WV and O3 rates are affected by defn : I take in N years of data and for latbin i, layer j, the data that goes into the rate hopper is $$ x = \frac{data(i,j)}{mean(data(i,:))} $$ … the denominator changes as time goes on ….
Plot of the geophysical and OLR rates
2 year rates 2002/09-2004/08
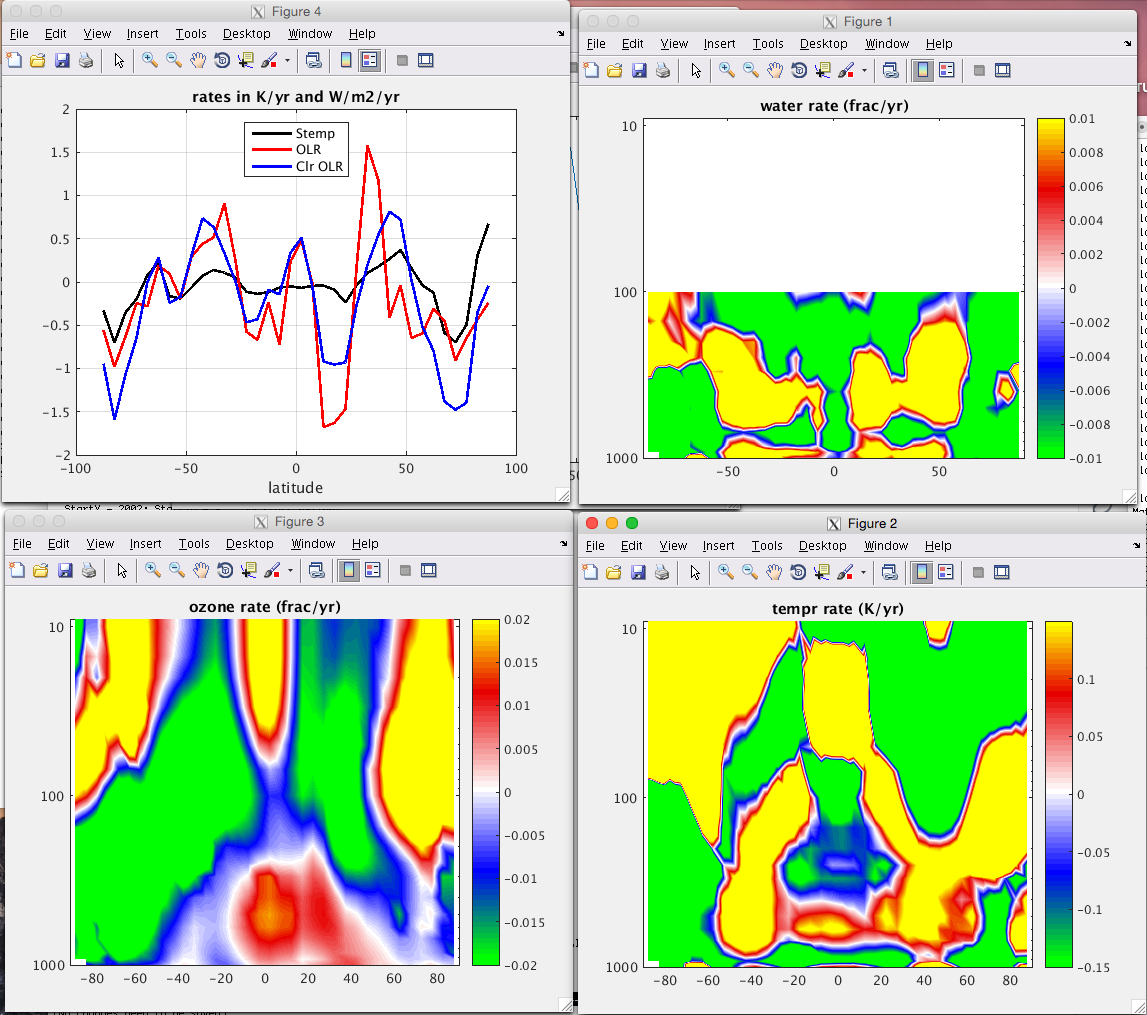
4 year rates 2002/09-2006/08
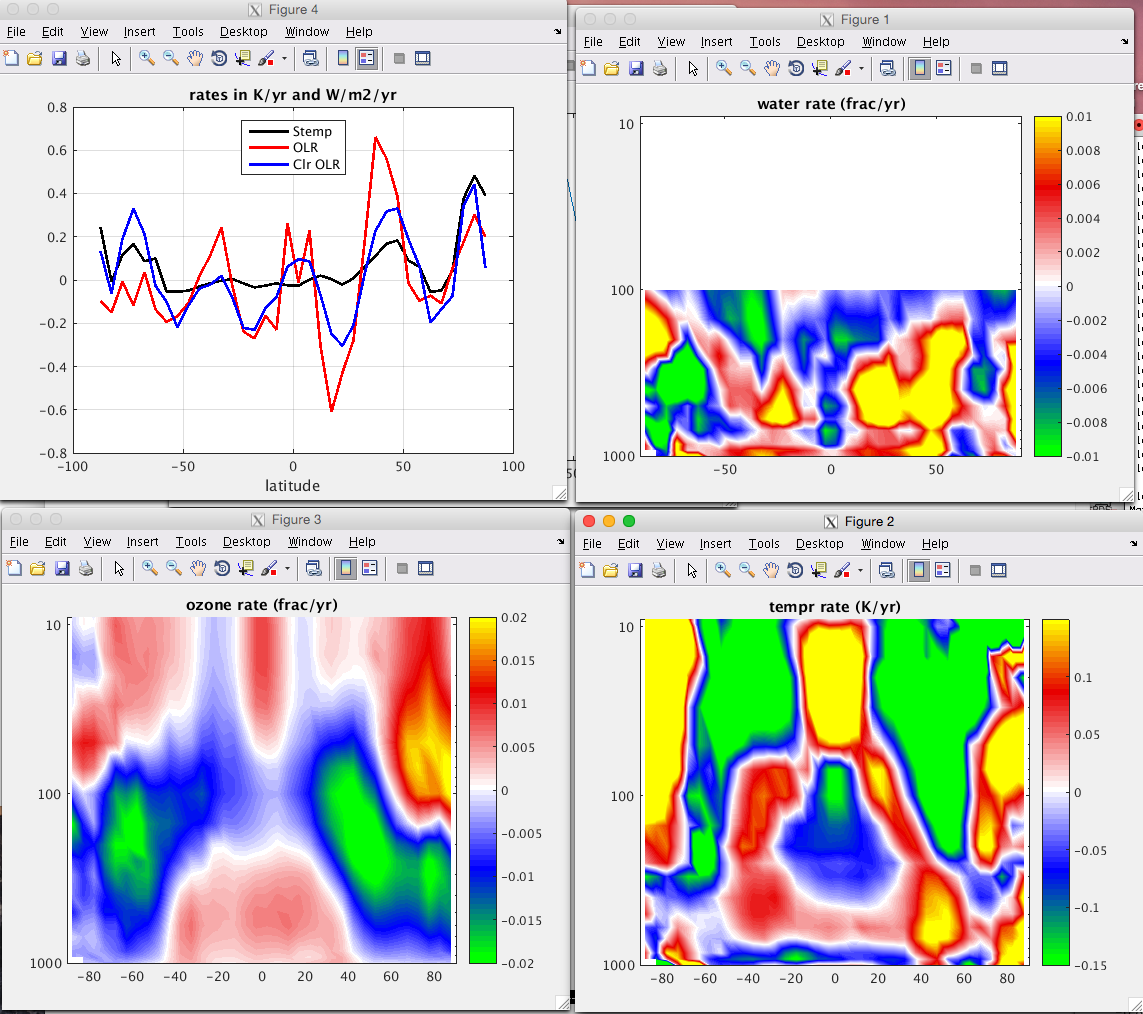
6 year rates 2002/09-2008/08
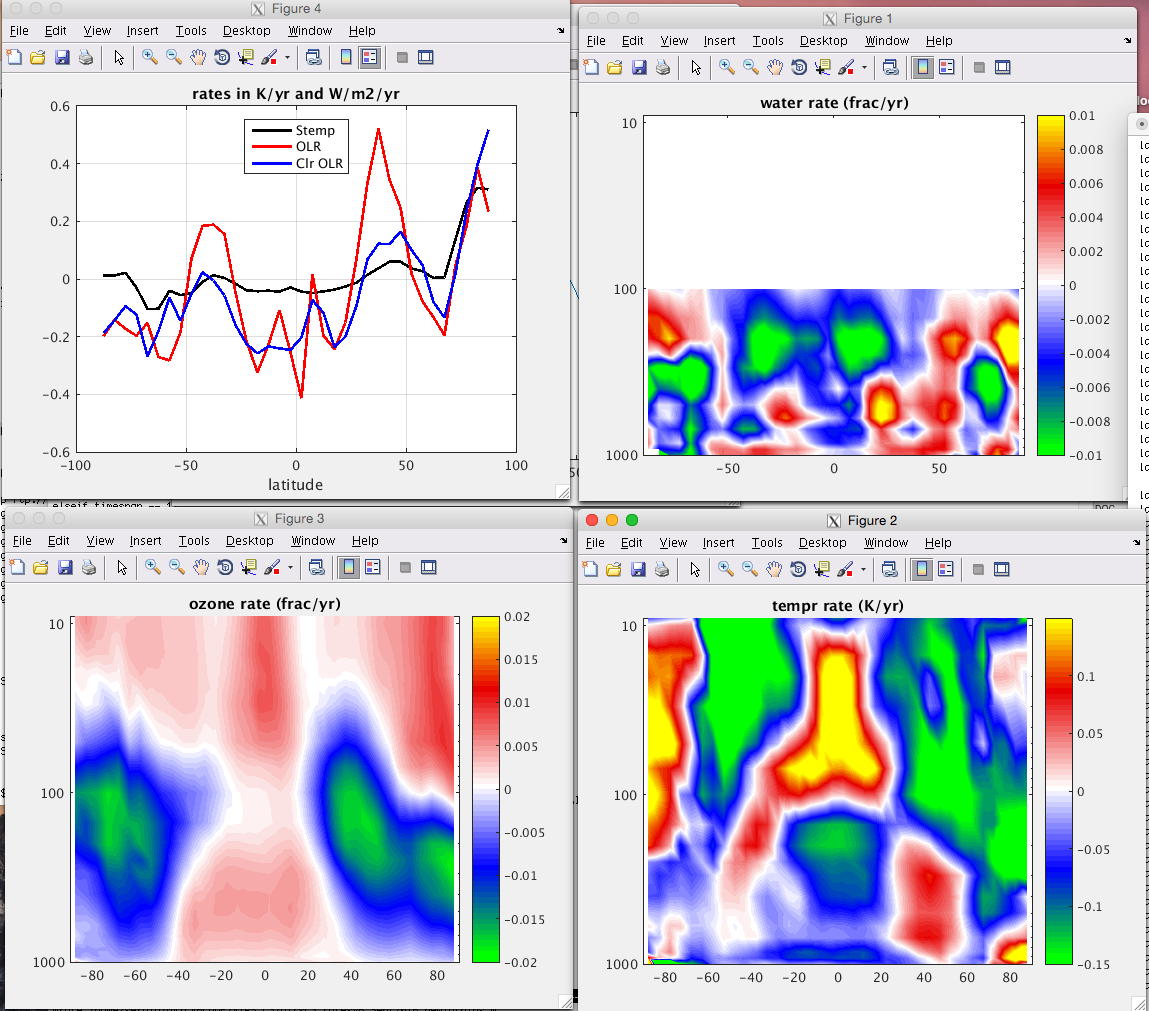
8 year rates 2002/09-2010/08
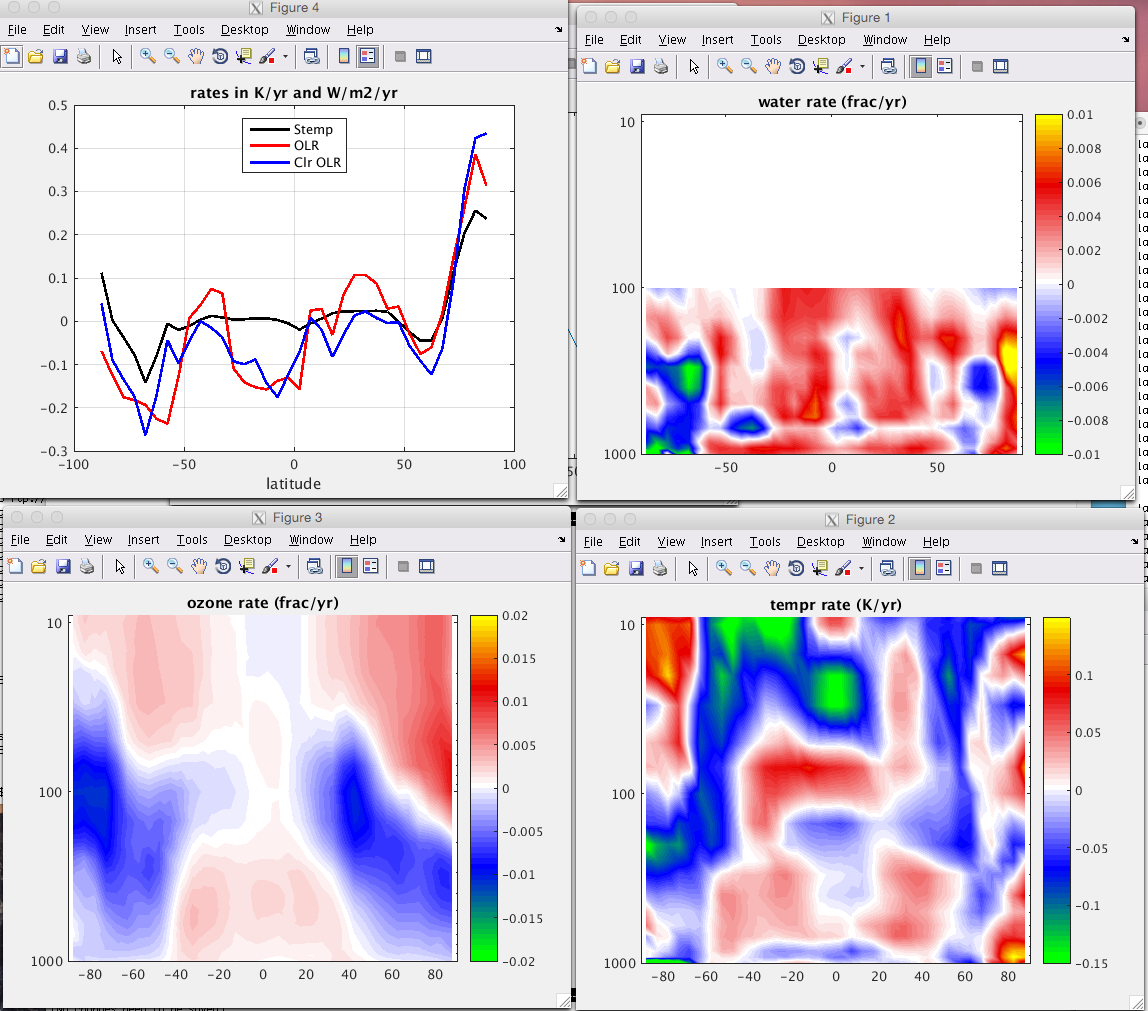
10 year rates 2002/09-2012/08
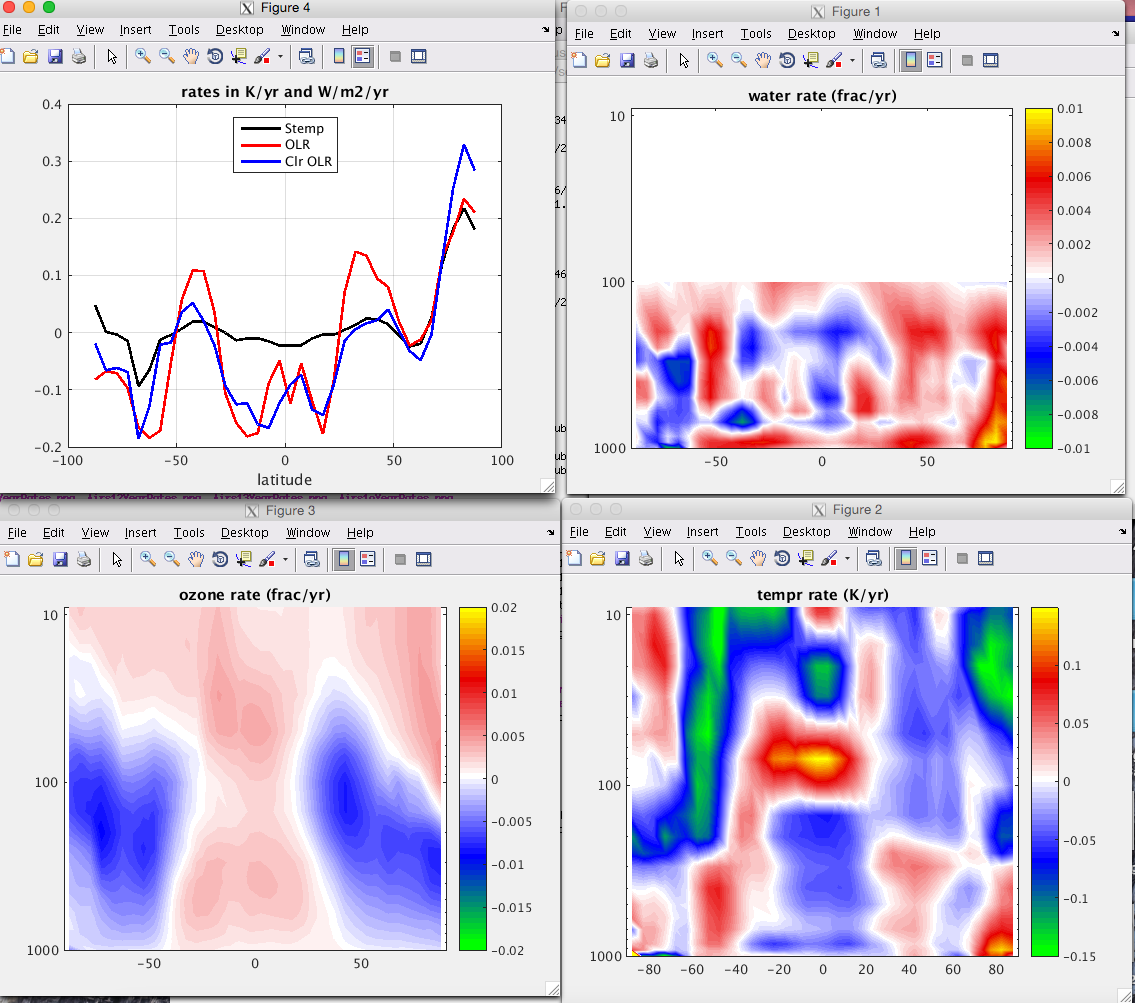
12 year rates 2002/09-2014/08
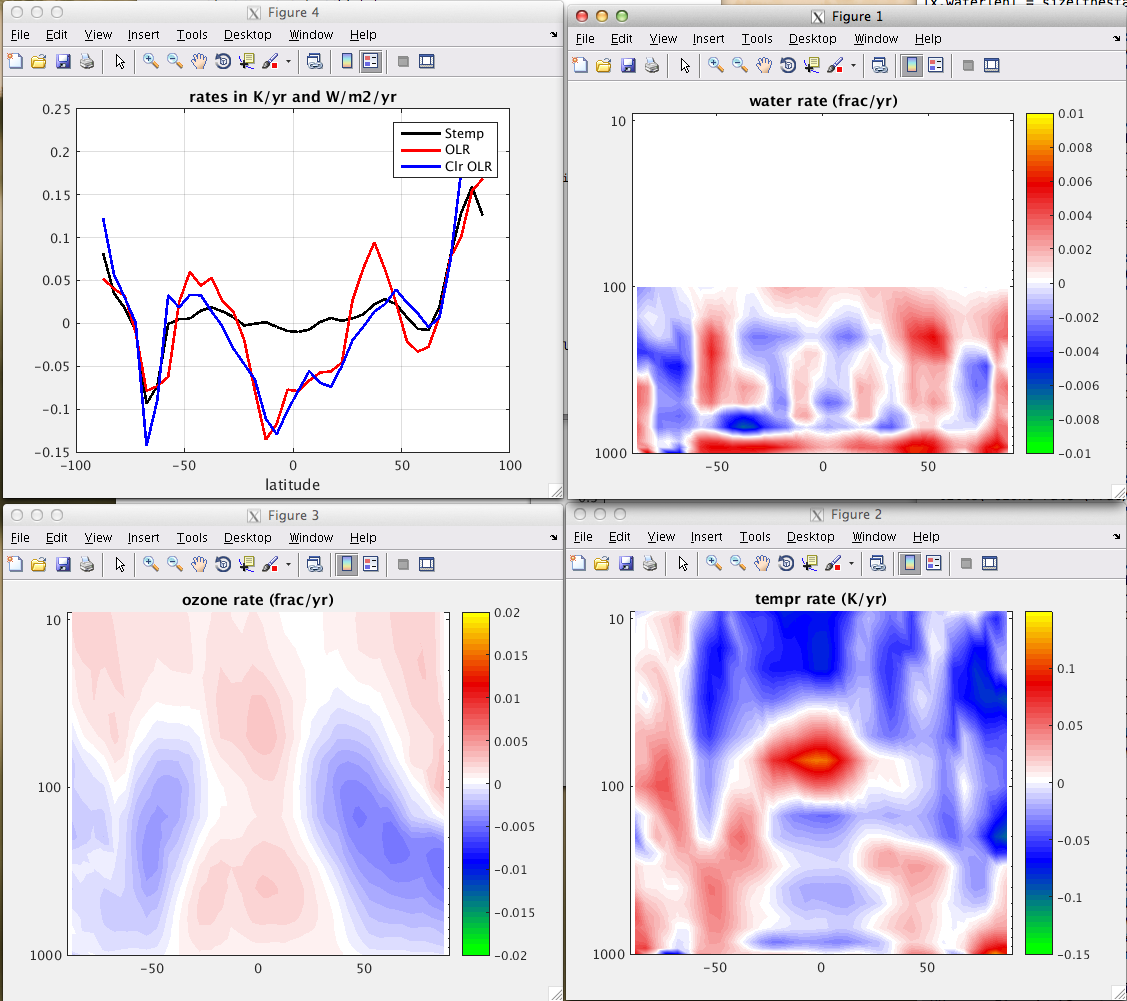
13 year rates 2002/09-2015/08
