Fast Coefficient Development for CrIS hi-res SARTA
Tue, Oct 18, 20161 Scope and Purpose
To describe how the fast coefficients are computed and record the main sources and dependencies.
No attempt is made here to describe or justify the regression algorithms used. The main effort is to take the existing framework left by Scott Hannon and use it to generate the new fast code for the CrIS high-resolution spectra.
The main discussion relates to using the 49 regression profiles, for which Scott Hannon originally designed the code. A supplement at the end addresses the modifications and other changes required to fit to a different regression set, in this case the SAF704 set.
2 Main sets 1 to 7
The main coefficient sets are numbered 1 to 7, and include coefficients for all channels of the CrIS hi-res, with four guard channels, once for each channel - i.e. no gaps or duplications. Each set includes a number of channels selected according to their proximity to the absorption lines that are being fitted in each set and these are given in the channel list files. Sets 1 and 2 encompass the LW band of CrIS, set 3 the MW band and sets 4 to 7 the SW band.
There are four major steps in producing the coefficient sets 1 to 7, Firstly, after choosing the breakout gases or mixed paths to use and the computation of the monochromatic L2S tramsittances, the results are convolved with the instrument spectral response function. Second, an interface script called doall_wrtconvdat_clh.m is used to compile the required breakouts from the convolved L2S transmittance files for each of the regression profiles and reference gas amounts into one file for the regression computations. Third, all the seven sets are computed using 7 separate programs, then the selected channels for each set are cut out. Fourthly, the water continuum is merged into each set separately. The last three stages use programs written in Fortran. There are shell scripts available to help manage the manual process.
2.1 Sets 1 & 2 (LW band) breakout and channel list
Original layer-to-space calculations were driven from the various namelists files and scripts in: /asl/s2/hannon/AIRS_prod08/CrIS/Run_trans_cris/.
Breakout gases and mixed paths used are:
- all gases have weight 1.0, except H2O and O3 have weight 0.0 (F)
- all gases have weight 1.0 except H2O has weight 0.0 (FO)
- all gases have weight 1.0 (FOW)
- all gases have weight 1.0 except CO2 has weight 1.05 (FOWP)
Convolved kcarta L2S transmittances are at:
/home/sergio/MATLABCODE/REGR_PROFILES/RUN_KCARTA/REGR49_400ppm/F/
/home/sergio/MATLABCODE/REGR_PROFILES/RUN_KCARTA/REGR49_400ppm/FO/
/home/sergio/MATLABCODE/REGR_PROFILES/RUN_KCARTA/REGR49_400ppm/FWO/
/home/sergio/MATLABCODE/REGR_PROFILES/RUN_KCARTA/REGR49_400ppm/FWOP/
Channel lists are at: ftc_dev/chanLists/list_crisSet1_hrg4 and list_crisSet2_hrg4.
Compiled ctrans data files at: /asl/s1/chepplew/projects/sarta/prod_2016/Prof400/Prof_FOW/
2.2 Set 3 (MW band) breakout and channel list
Breakout gases and mixed paths are:
- all gases have weight 1.0 except H2O and CH4 have weight 0.0 (F)
- all gases have weight 1.0 except H2O has weight 0.0 (FM)
- all gases have weight 1.0 (FMW)
Convolved kcarta L2S transmittances are at:
/home/sergio/MATLABCODE/REGR_PROFILES/RUN_KCARTA/REGR49_400ppm/ch4bandF/
/home/sergio/MATLABCODE/REGR_PROFILES/RUN_KCARTA/REGR49_400ppm/ch4bandCH4/
Channel list is at: ftc_dev/chanLists/list_crisSet3_hrg4.
Compiled ctrans data files at: /asl/s1/chepplew/projects/sarta/prod_2016/Prof400/Prof_FMW/
2.3 Sets 4, 5, 6 and 7 (SW band) breakout and channel list
Breakout gases and mixed paths are:
- all gases have weight 1.0 except H2O, CO, and O3 have weight 0.0 (F)
- all gases have weight 1.0 except H2O and O3 have weight 0.0 (FC)
- all gases have weight 1.0 except H2O has weight 0.0 (FCO)
- all gases have weight 1.0 (FCOW)
- all gases have weight 1.0 except CO2 has weight 1.05 (FCOWp)
Channel lists are at: ftc_dev/chanLists/list_crisSet4_hrg4, /list_crisSet5_hrg4, /list_crisSet6_hrg4 and /list_crisSet7_hrg4
Compile ctrans data files at: /asl/s1/chepplew/projects/sarta/prod_2016/Prof400/Prof_FWOsun/
2.4 Regression Fitting for sets 1 to 7.
For convenience a shell script is available at:
ftc_dev/scripts/run_fitftc
that operates on the regression files using the selected executable prescribed by the FITSET and DATATYPE variables.
There is an executable program for the regression of each of the 7 sets, that can be found in ftc_dev/Bin/fit_set{1-7}_*, where * refers to a code to help keep track of the type of predictors used in the fitting. The result is a set of coefficients for the break out gases for all channels, and the next step is to merge these with the water continuum coefficients (see next section). This produces a file with all channels included so the final step is to cut out the channels required, using the channel lists described above.
There is a separate merge and a separate cut program for each of the 7 sets of coefficients also found in /ftc_dev/Bin/merge_set{1-7} and cutlistcoef_set{1-7}, these are also written in Fortran.
3 Water Continuum
3.1 Layer to space transmittances
Source: ftc_dev/fit_con/src_fitcon/
and: ftc_dev/fit_con/scripts/run_lbl_cris
Regression profiles: /home/sergio/MATLABCODE/REGR_PROFILES/RUN_KCARTA/REGR49_400ppm/
regr49_1100_400ppm.op.rtp
with: refprof_truth_jul2000.mat or refprof_regr49_1100_400ppm.mat
A master script is used to drive the matlab template file: run_lbl.m, that runs the run8watercontinuum() line-by-line functions which is configured to use model CKD 6. There are other dependencies and child procs in the source directory. This produces a mat file at the native resolution of 0.25 wavenumber, over an extended spectral range, written to file: wcon8_ckd6_lbl_640_p25_2560.mat.
3.2 Fitting routine
Source: ftc_dev/fit_con/scripts/run_fit
and: ftc_dev/fit_con/src_fitcon/fit_watercon.m
with: refprof_truth_jul2000.mat or refprof_regr49_1100_400ppm.mat
The bash script run_fit is used to control the matlab template file with the dependencies set accordingly. This produces a full resolution coefficient file: wcon8_ckd6_r49_rawcoef.dat, which must be interpolated on the CrIS spectral grid using the script: run_interp that can be run using the individual channel listings for each of the seven sets or once for the full CrIS channel list. Note that the continuum coefficients are smoothly varying with frequency so the interpolation method is robust. This produces 'mat' files according to the channel sets used. The option used here produces the complete channel set: wcon8_ckd6_r49_coef_cris_hrg4.dat.
The water continuum coefficients are then merged with the 7 breakout sets, see above.
4 Optran Water Lines
As with sets 1 to 7, the fitting routines are written in FORTRAN.
The L2S convolved transmittance files used for set 3 (FMW) are used for optran fitting.
The main region for fitting water lines is the MW band of CrIS. There are two main programs available depending on the configuration file and breakouts used: fowp and fmw. Scott has other slight variations of the method based on which routine he uses for the effective optical depth. The executable used is the fmw variant. Other options have been investigated.
Convolved kcarta L2S transmittance files: - as above for FMW -
Source: ftc_dev/src_fitftc/ and script ftc_dev/scripts/run_fitftc
executable: ftc_dev/Bin/fit_optran_fmw and fit_optran_fowp.
Data files: /asl/s1/chepplew/projects/sarta/prod_2016/Prof400/Prof_FMW/
The regression routine creates a coefficient file, here named CrIS_hrg4_rawcoef_optran_fmw.dat. This file requires a header section to be included. The header is created using:
ftc_dev/Bin/optheader that requires the grid files for optran:
ftc_dev/scripts/azfwocm_jul00.txt and predavg.txt
and the header concatenated to the coefficient file simply:
cat optran_header_file coefficient_file > optran_coef.dat
5 Reflected Thermal
5.1 New Method:
The orignal fitting routine, ftc_dev/fit_therm/fittherm6cris.m gave unsatisfactory results, so although the current sarta program expects to load a thermal coefficient data file, these data are not used. Instead the calrad.f module has been changed to recompute the downward thermal flux and then the reflected component without the use of the F-factor approach originally adopted by Scott Hannon.
5.2 Production check
Sarta was built with the new calrad.f module and tested using kcarta generated data using regression sets:
regr_rtp_6angs_49profs_1013mb_seaemis_2235.rtp and
regr_rtp_6angs_49profs_1013mb_unitemis_2235.rtp
and TOA radiances:
/asl/s1/sergio/home/kcartaV118/WORK/RUN_TARA/GENERIC_RADSnJACS_MANYPROFILES/...
JUNK/xconvolved_kcarta_crisHI_xconvolved_kcarta_crisHI_1013mb_unitemiss.mat and \\ JUNK/xconvolved_kcarta_crisHI_xconvolved_kcarta_crisHI_1013mb_seaemiss.mat.
Results are shown in the figure

6 non-LTE
Code sources at: ftc_dev/fit_nonLTE/merge_RnonLTE_CrIS_hrg4.m
and: ftc_dev/fit_nonLTE/src/fitnonLTE_cris_jun2016.
with associated child procs.
Data sources at: \\ /home/sergio/MATLABCODE/REGR_PROFILES/RUN_KCARTA/REGR49_400ppm/regr49_1100_400ppm.op.rtp
and
/home/sergio/KCARTA/NONLTE/VT_48PROFILES_120_400ppmv_v118/Results/CONV_Results/
Supporting files: ftc_dev/fit_nonLTE/src/wrtcoef_nte.m
The matlab script merge_RnonLTE_CrIS_hrg4.m is used to merge the convolved kcarta radiances at the 36 combined sun and view angles listed above, and the temperature profile from the reference atmosphere. The merged file is stored at: \\ /asl/s1/chepplew/projects/sarta/cris_hr/nlte_raddata_cris_hrg4_400ppm.mat.
Next, the matlab script fitnonLTE_cris_jun2016.m takes the merged file and runs the regression and creates the coefficient set. Note that this requires an input file of one minus ratios as a function of frequency, or channel. All values have been set to zero in: /home/chepplew/projects/sarta/cris_hr/dummy_nlte_cris_hrg4_ratios.txt. Also, in the code a CO2 ratio is set to 1.0% as a placeholder since the analysis is based upon 400ppm CO2. The script has the wanted channels (frequencies) already hard coded but allows for them to be reviewed using a data plot.
Two coefficient data files are written: cris_hrg4_nte_400ppm_6term.dat and cris_hrg4_nte_400ppm_7term.dat.
7 SO2
Source data: /home/sergio/MATLABCODE/REGR_PROFILES/RUN_KCARTA/REGR49_400ppm/so2bandF
and: so2bandS
Merged file: /las/s1/chepplew/projects/sarta/prod_2016/Prof_SO2/cris_hrg4_so2_data_long.mat
Code sources: ftc_dev/fit_so2/merge_ctrans_and_prof_so2_hires.m
and: fit_so2_all_cris.m
Channel list: ftc_dev/fit_so2/cris_coef_so2_list.txt
The original approach of Scott has been followed but implemented slightly differently. The optical depth scaling has been taken out of Scott's original merge routine and coded into the fitting routine.
8 N2O
Source data: /home/sergio/MATLABCODE/REGR_PROFILES/RUN_KCARTA/REGR49_400ppm/
n2ohno3bandF
and: n2ohno3bandN2O
Merged file: /asl/s1/chepplew/projects/sarta/prod_2016/Prof400/Prof_N2O/
crishires_n2o_data_long.mat
Code sources: ftc_dev/fit_n2o/merge_ctrans_and_prof_n2o_hires.m
and: fit_n2o_all_cris.m wrtcoef_n2o.m
Coefficient file: ftc_dev/fit_n2o/crishiresg4_allcoef_n2o_long.dat
The routine merge_ctrans_and_prof_n2o_hires.m is used to compile the 49 convolved tramsission files and reference profile into a single data file. The routine fit_n2o_all_cris.m is used to run the regression and write the coefficient file. A conversion tool is required to create the fortran binary data file used by SARTA.
9 HNO3
Source data: /home/sergio/MATLABCODE/REGR_PROFILES/RUN_KCARTA/REGR49_400ppm/
n2ohno3bandF
and: n2ohno3bandHNO3
Merged file: /asl/s1/chepplew/projects/sarta/prod_2016/Prof400/Prof_HNO3/
crishires_hno3_data_long.mat
Code sources: ftc_dev/fit_hno3/merge_ctrans_and_prof_hno3_hires.m
and: fit_hno3_all_cris.m wrtcoef_hno3_cris.m
Coefficient file: ftc_dev/fit_hmo3/cris_hrg4_allcoef_hno3.dat
The routine merge_ctrans_and_prof_hno3_hires.m is used to compile the 49 convolved tramsission files and reference profile into a single data file. The routine fit_hno3_all_cris.m is used to run the regression and write the coefficient file. A conversion tool is required to create the fortran binary data file used by SARTA.
10 Variable CO2
The convolved kcarta L2S transmittance source data are the same as used for the set1 and2 above:
/home/sergio/MATLABCODE/REGR_PROFILES/RUN_KCARTA/REGR49_400ppm/FWOP_1.05
and /F, /FO, /FWO.
The mixed gas paths used are paths 3 and 4:
iii). all gases have weight 1.0 (FOW)
iv). all gases have weight 1.0 except CO2 has weight 1.05 (FOWP).
Merged files at: /asl/s1/chepplew/projects/sarta/prod_2016/Prof400/Prof_FWOp/
The fitting routines were created and used by Scott and are included in the main source directory with the main sets 1 to 7.
ftc_dev/src_fitftc/.
There are two versions using either 4 or 5-term fitting routines:
i). ./Bin/fitftc_co2_fowp and ii) ./Bin/fit_co2_5term_fowp_sun
For research purposes a matlab routine was written to allow easier investigation and development and can be found in:
ftc_dev/fit_co2/fit_co2_all_cris.m
This routine includes the interface handler for Sergio's kcarta L2S files as well as the regression code.
For this work the 5-term fitting routine was used to create the fast coefficient set. The fitting was checked using the perturbed profile regression set:
/asl/s1/chepplew/projects/sarta/cris_hr/testperturb_2235.rp.rtp
and compared to the kcarta TOA radiances at:
/asl/s1/sergio/home/kcartaV118/WORK/RUN_TARA/GENERIC_RADSnJACS_MANYPROFILES/JUNK/convolved_kcarta_crisHI.mat
11 Spectral Grids
The formulation of the method used here takes the native and natural spectral grid inherent in the kcarta line-by-line calculations of the layer-to-space transmittances, this means that the channel frequency and channel number, or index, increases monotonically from the longest wavelength (index 1) to the shortest wavelength (highest index - being 2235).
This means that the coefficient data files created here can be used with SARTA to compare spectra directly with those produced using the kcarta LBL, without channel or frequency mis-alignment. The first value in coefficient set 1 has channel index 1 and highest frequency (longest wavelength) and so forth.
SARTA is desinged to be table driven, that is supposed to allow for irregular grids, as used by CrIS with guard channels. Guard channels are simulated channels at each end of the three spectral bands of CrIS that extend the frequency range beyond the instrument band edges to reduce edge ringing in processing the interferometric data. However, the guard channel indexes are added on to the high numbered end of the actual instrument index. So the lowest frequency guard channel has index 2212 and so forth. When SARTA loads the coefficient data and an RTP file it compares the index and frequency of each according to the order in which they appear and are loaded into SARTA. If either index or frequency are not identical a warning is issued, and SARTA will proceed with the computation in the order supplied by the reader. This may lead to mis-alignment of the spectral grids of the loaded RTP file and the loaded coefficients.
The coefficient data files should be modified so that the indexing matches that given in the RTP files for CrIS with guard channels. This should be a simple task of identifying which if any channels in a given coefficient file coincide with a guard channel (by frequency) and allocating it's index to the appropriate guard channel index. In principle a guard channel could appear anywhere in a coefficient file or not at all.
11.1 Normal grid used by kcarta
In the case where the native grid used by kcarta in the original L2S formulation, a set of coefficients and a version of sarta can be built to match them channel by channel. The file names have subscript kc.
11.2 Special grid used by CrIS
In the case of CrIS with guard channels added at the ends of each of the three main spectral bands, and where these guard channels are incremented at the end of the channel list. So they take the highest channel numbers. A routine is used to convert the native set produced directly fro the kcarta work above and re-assign channel numbers:
ftc_dev/reorder_guard_chans.m
For the purposes of continuity to earlier versions of sarta and for use with other sensors, AIRS and IASI, the default file names are used, thus /Data_CrIS_sep16/Coef/set1.dat is the coefficient set for CrIS hi-res with 4 guard channels, and so forth.
12 Appendix - Validation Tests
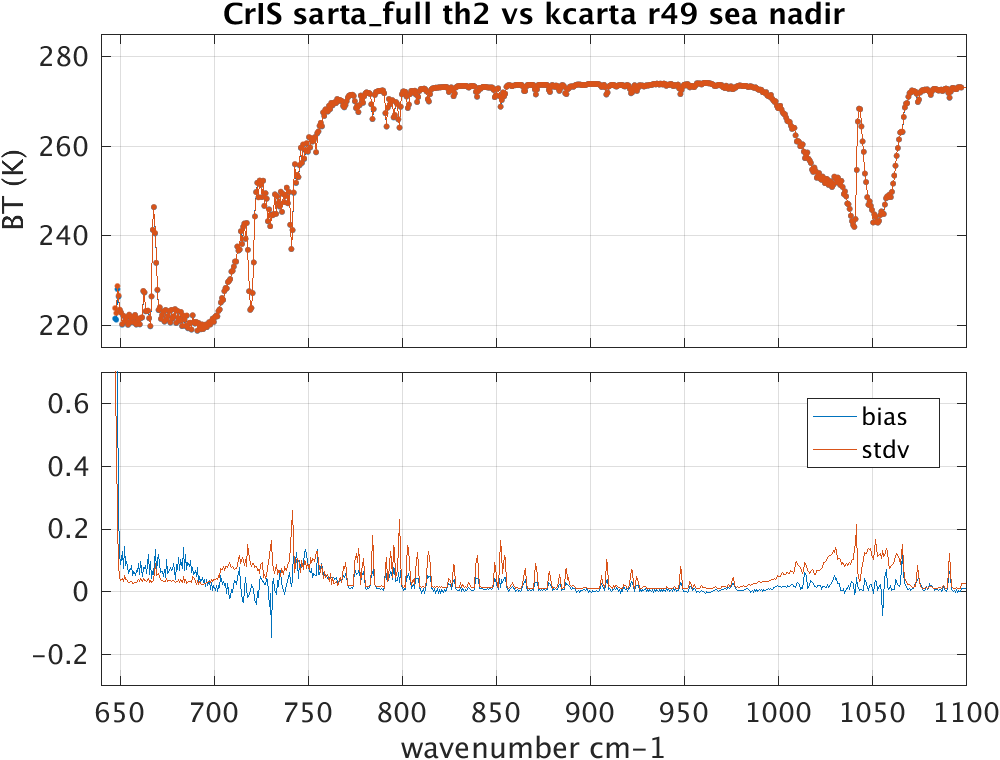
12.1 TOA radiances - mean 49 regression profiles.
The following three figures show the mean TOA brightness temperature spectra for the SARTA predictions compared to the kcarta calculations for the 49 regression profiles, with sea surface emissivity, used to evaluate the fast coefficients. In each plot the abscissa is wavenumber (cm-1) and the ordinate is the B.T. in Kelvin. The upper pane is the mean spectrum and the lower shows the mean bias and standard deviation of the difference. In the following set, calculations are made only at nadir. (see below for larger zenith view angles).


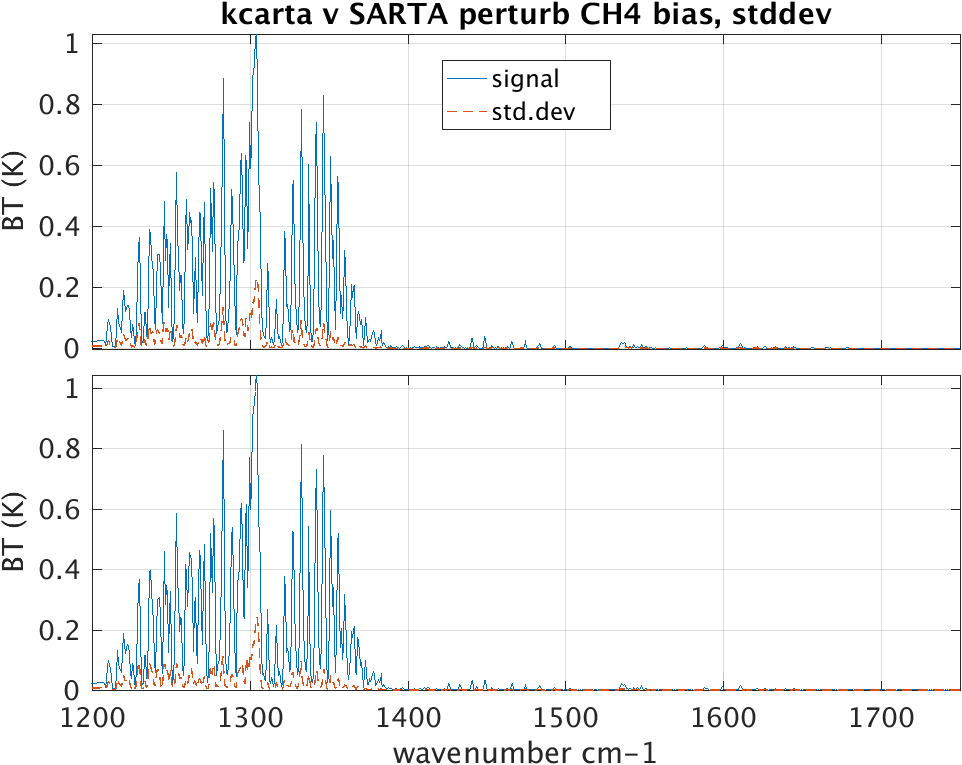
12.2 TOA Radiance - minor gas perturbation tests
In each of the following graphics there are two panes. The upper pane is the kcarta result, and lower pane the new sarta result. In each case one of the minor gases from 6 of the original 49 regression profiles were perturbed by +10% over all altitudes. The result the mean difference due to the perturbed gas compared to the original unperturbed profile.


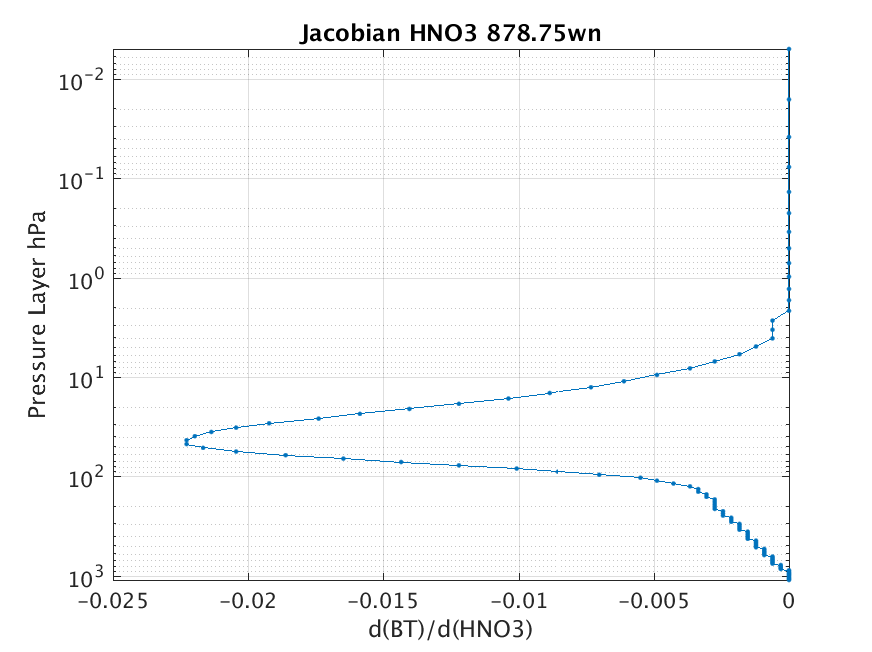
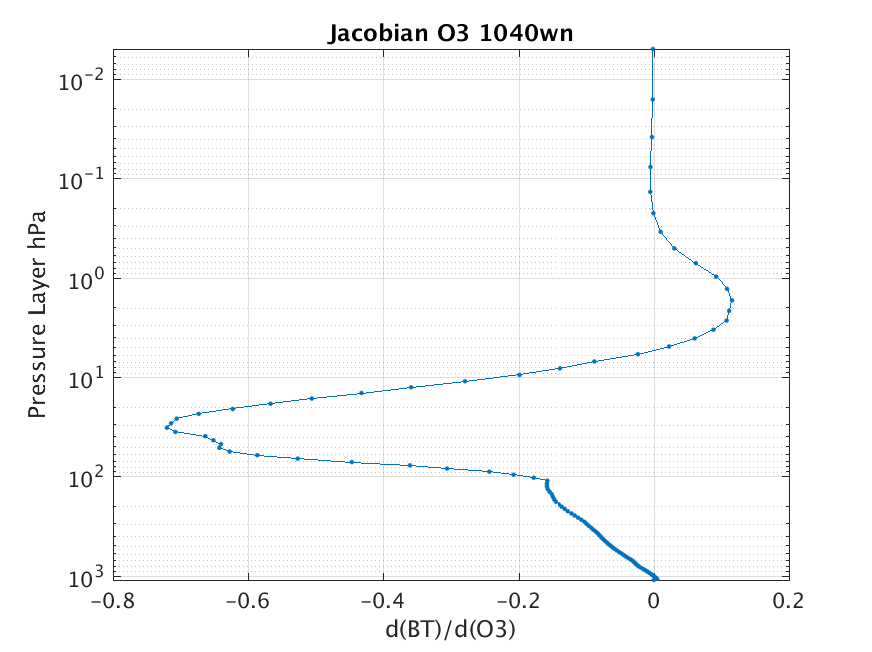
12.3 Jacobians
In each of the following plots the Jacobian (d(BT)/d(xG) where xG is the fractional change of the minor gas normalized to 1%. In the case of the profile plots, the minor gas is perturbed by 10% at each level alone from surface layer to TOA layer in turn. In the case of the spectal Jacobian the whole profile for the minor gas is perturbed by +10%.


13 Supplement: Summary of method and changes for the SAF704 regression set.
13.1 Key Steps to Production
1- Start with the individual kcarta L2S transmittance files (one for each regression profile) for each of the breakouts, 2- Compile these L2S files into new groups as required by the fitting code, using the matlab script doall_wrtconvdat_clh.dat (Ensure the I/O paths are set up correctly beforehand). 3- For the fixed gases, sets 1 thro' 7, optran water, variable CO2, use the fortran library of functions built from the source code in src_fitftc/ and support script in scripts/run_fitftc. Ensure I/O paths have been set up beforehand and update this script accordingly. 4- Do the fitting (see above) for sets 1 thro' 7 amd the water continuum, to produce raw coefficient files. 5- Merge the raw coefficient files for set1 thro' 7 with the water continuum using the functions built from source code in src_mergecut/. In each case ensure the included file: farra_<something>.f has been updated accordingly. 6- Cut out selected instrument channels from these 7 merged coefficient files using the functions built from source code in src_mergecut/. in each case ensure the included file: farray_<something>.f has been updated accordingly. 7- For CrIS using guard channels, these files of cut coefficients must re-ordered so that the default kcarta channel numbering is modified to correctly locate the guard channels at the highest numbered channels for SARTA. Use the matlab script reorder_guard_chans.m with paths and search terms updated accordingly.
13.2 Compilation of the layer-to-space optical depths
Data: The SAF 704 regression profiles are selected by Sergio from the complete 25,000 profile set supplied by ECMWF. (SAF stands for satellite applications facility, see for example https://nwpsaf.eu/site/software/atmospheric-profile-data/ ). These profiles are then transposed on to the standard 100 layers used at ASL with the klayers routine and are stored at:
/home/sergio/MATLABCODE/REGR_PROFILES/ECMWF_SAF_137Profiles/save_SAF_704_profiles_29-Apr-2016_1100mb.op.rtp
there are other versions depending on surface emissivity.
The layer-to-space (L2S) optical depths are computed using kcarta using a selection of different mixed gas paths (referred to as break-outs) and with specific boundary conditions, and for 12 viewing angles to produce the dependent variable onto which the predictors are to be fitted. The optical depths are convolved to the CrIS (or AIRS) spectral response functions, or instrumetn line shapes. These data are at:
/home/sergio/MATLABCODE/REGR_PROFILES/RUN_KCARTA/SAF704/F, FW, FWO, wvband*, so2band*, n2ohno3band*, and n2ohno3band.
For Scott's fitting code these convolved L2S data must be compiled into groups and reformatted to fortran binary files using the matlab routine doall_wrtconvdat_clh.m
This routine has been modified to accommodate the two different sets of regression profiles, the 49 set and the SAF704 set. These files are stored at:
/asl/s1/chepplew/data/sarta_wrk/prod_2016/p400/FMW, FWO, FWOp, with filenames starting with CRIS_SAF704_allPaths_.
13.3 Fitting the standard breakouts, sets 1 to 7.
Code: The fitting routines must be re-built with update parameters, for each farray_setX.f the maxmum profiles must be updated: PARAMETER(MAXPRO=703). Once the executable code is rebuilt and the correct input parameters are supplied the fitting code completes.
The merge with the water continuum and the cutting routines remain the same.
13.4 Fitting the water continuum
The line-by-line routine that runs the continuum model (scripts/run_lbl) on the SAF704 profiles, the fitting routine (scripts/run_fit) and the interpolation routine (scripts/run_interp) remain the same, but with the input and output paths updated accordingly.
RTPIN=/asl/s1/chepplew/projects/sarta/cris_hr/SAF704_regprofs_29apr2016_1100mb.op.rtp
and output files are written to:
/asl/s1/chepplew/data/sarta_wrk/cris_hr/Prof_LBL_water/SAF704_water*
and
/asl/s1/chepplew/data/sarta_wrk/cris_hr/wcon8_ckd6_saf704_lbl_640_p25_2670.mat
The fitting routine output is:
/asl/s1/chepplew/data/sarta_wrk/cris_hr/rawcoef_wcon8_ckd6_saf704_640_p25_2670.dat
and the output of the interpolation routine is:
/asl/s1/chepplew/data/sarta_wrk/cris_hr/interpcoef_wcon8_ckd6_saf704_cris_hrg4.dat
13.5 Fitting Optran water
The optran fitting code is a part of the Fortran code set, and the include file: farray_optran_fmw.f must be updated with the number of atmospheric profiles used and the executable re-built. Since the FMW break-outs are used the compilation routine doall_wrtconvdat_clh.m must be run first on the L2S files. The coefficient data are written to:
ftc_dev/run/saf704/cris_hr/CrIS_hr_rawcoef_optran_fmw.dat
Do not forget to append the optran header to the coefficient file (see above).
The cutlistcoef_optran program remains unchanged, and the cut coefficient set is:
ftc_dev/run/saf704/cris_hr/CrIS_hr_cut_optran_fmw.dat