May 19, 1999
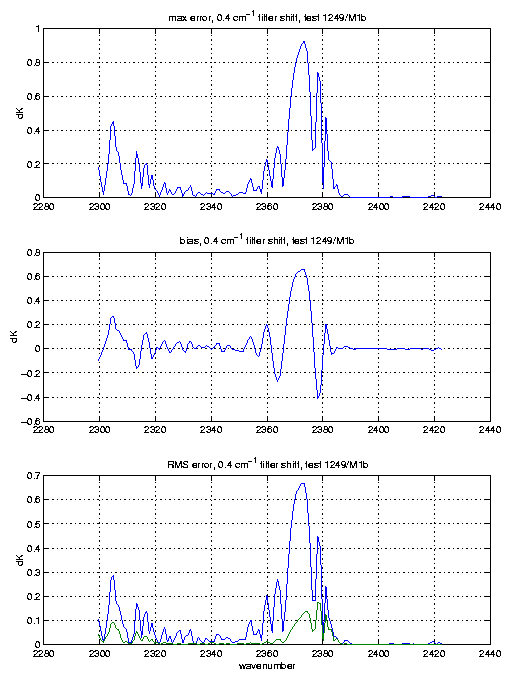
We have performed a simulation of the maximum, bias, and rms errors that could result if the entrance filter fringes move by an unknown phase after calibration. This simulation used the filter transmission curves we obtained from Margie Weiler at Lockheed to produce SRFs with similar characteristics to those actually observed with the Bruker spectra. These simulations do not actually reproduce the SRF's on a per SRF basis, but they do exhibit the same basic range of behavior.
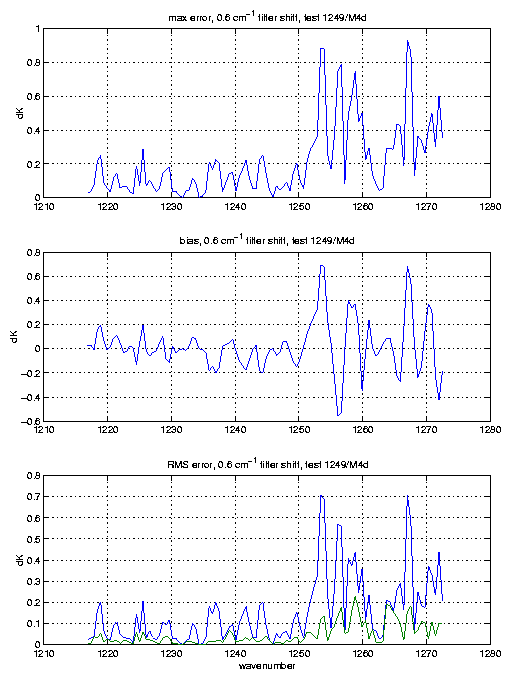
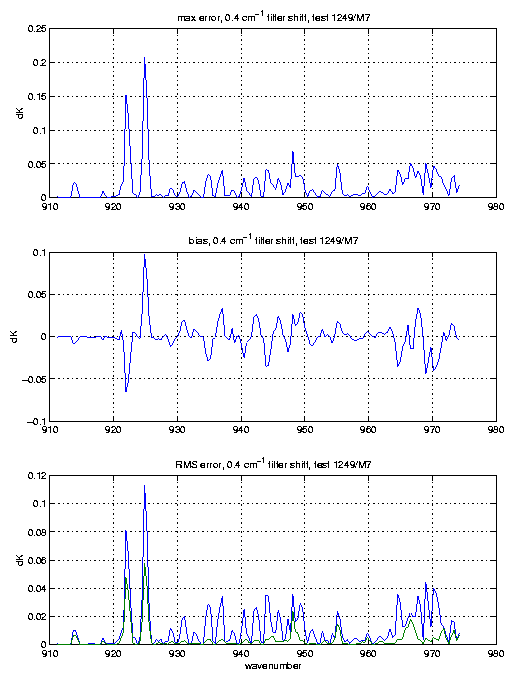
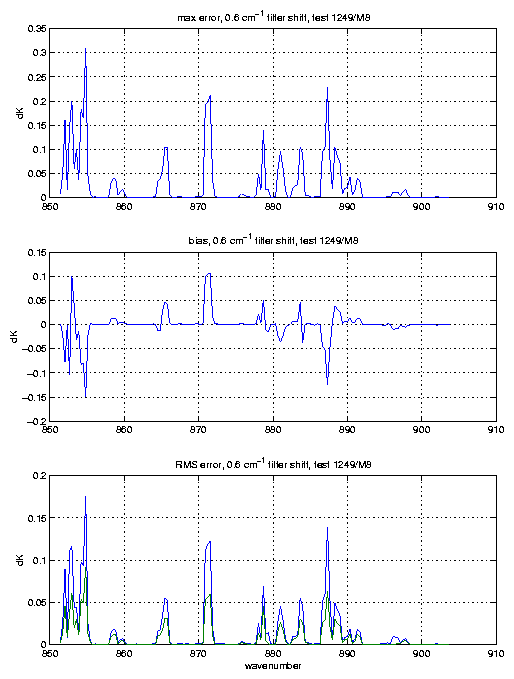
With these simulated SRFs and fringes we can then move the fringes around relative to the SRF centers. The following plots show the errors in brightness temperature, on a per channel basis, that would occur if you had no knowledge of the fringe phase.
The bias and rms errors are over the 8 profiles used. We determined the bias and rms errors over 8 profiles separately for each possible fringe position. The fringe positions were moved in units of 20% of a fringe period; the reference position being no fringe shift, which was compared to fringe shifts of 20, 40, 60, and 80% of a fringe period. The plots show the bias and rms for the fringe position with the maximum errors, although they don't vary tremendously. The bottom panel in each plot shows the rms error both with (green curve), and without (blue curve) the bias removed.
M4c and M4d exhibit quite large errors, which cannot be tuned out since they are water lines, many at high altitudes. We expect similar errors for M3 (we don't have filter curves, but will simluate the M3 filter soon).
We also just completed simulations of the effects of fringing on M11, M12. We used a fringe contrast of 8%, which is similar to what we see on the other filters. The results are again problematic, with biases possible on the order of 0.5K, and rms errors around 0.1K if this bias is removed. A preliminary look at the simulated SRFs in this region indicate that the perturbations to the SRFs by the fringes are subtle, and it is not surprising that we haven't seen fringe effects directly in the SRF's and their widths. More work is needed to completely verify this observation. Since each M11/M12 channel has about 1/5 of a fringe across it, it is not inconceivable that fringe effects are important.
Conclusions: There is no way to assure that the fringe
phase will be in a known position, relative to the SRF centroids,
after launch. These simulations show that with no knowledge of the
fringe positions that will will have errors (biases) in the water
channels that are far larger than the noise. We cannot tune these
channels, radiosonde errors are up to 3K in brightness temperature
in these regions, and AIRS should be considered the truth. The
filters in the water region must be wedged.
The temperature sounding channels at 4.3 microns have bias errors of
up to 0.4K. It is possible that these biases can be tuned to the
0.1-0.2K level, but that is still higher than the noise. In
addition, if the time must be taken to procure wedged filters for the
water region, we should go ahead and procure wedged filters
for the important temperature sounding region as well.
Our very preliminary findings indicate that the fringes are also
important in the 15 micron region, again with biases larger than the
noise, that can be tuned below the noise level. The forward model
should be very accurate in this region. Again, we must wedge the
water region filters. I would think the extra cost of wedging the
15 micron filters is a good buy, once we have to delay waiting for
the water filters anyway.
This memo does not address the somewhat more severe problems with the field dependence of the focus. I just want to point out that even if these fringe problems are fixed, we still have very significant (and possibly larger) problems due to the scene dependent focus.

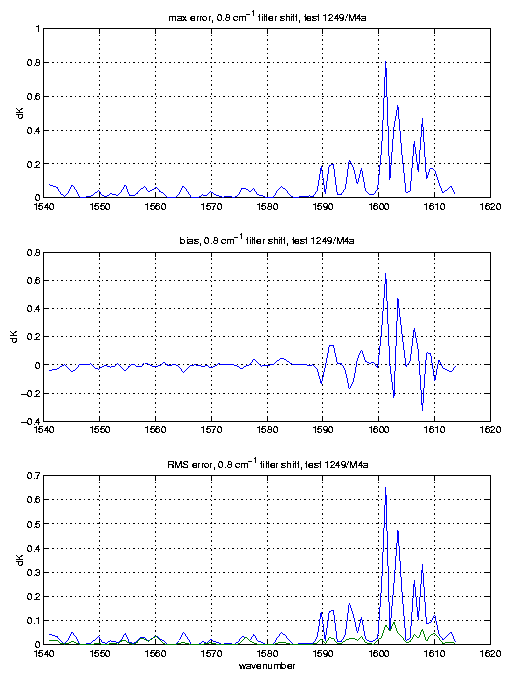
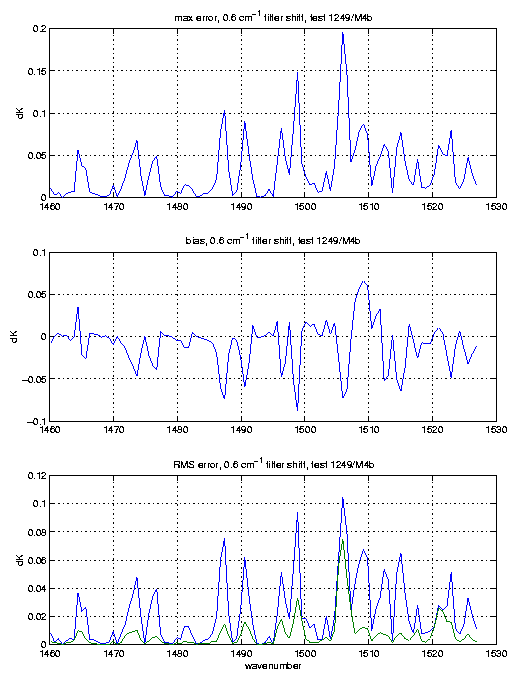
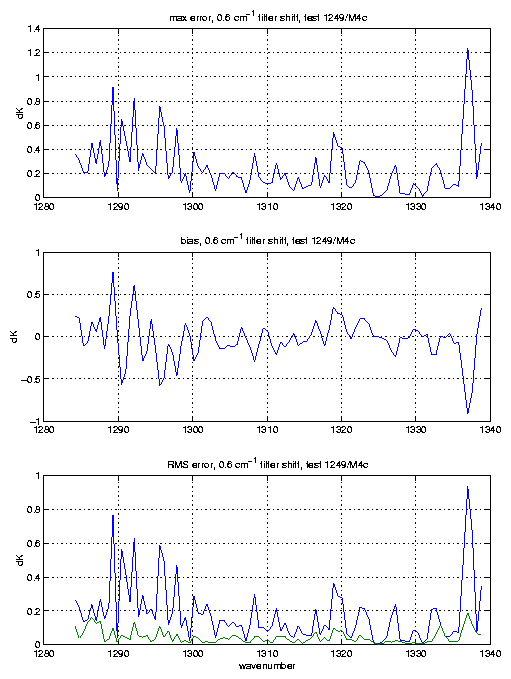
We have noticed that the actual SRFs have sharper features due to the fringes than what we simulate. If we increase the contrast of the fringes (from what was observed in the filter measurements) we start to affect the widths too much. We conclude that the actual fringes might be a little sharper (higher finesse) that what we have seen in the filter curves.